
Large Software Projects: Collecting Logs
Posted on October 27, 2025 • 6 minutes • 1084 words • Other languages: Español
This post is part of my Large Software Projects blog series .
- Code Source
- Blog Focus: The Logs
- Pino and pino-loki
- Next.js Instrumentation: Initializing the logger
- Logger Demonstration
- loki Configuration
- Define loki Docker Service
- Grafana Dashboard Setup
- What’s Next?
Code Source
All code snippets shown in this post are available in the dedicated branch for this article on the project’s GitHub repository. Feel free to clone it and follow along:
https://github.com/franBec/tas/tree/feature/2025-10-27
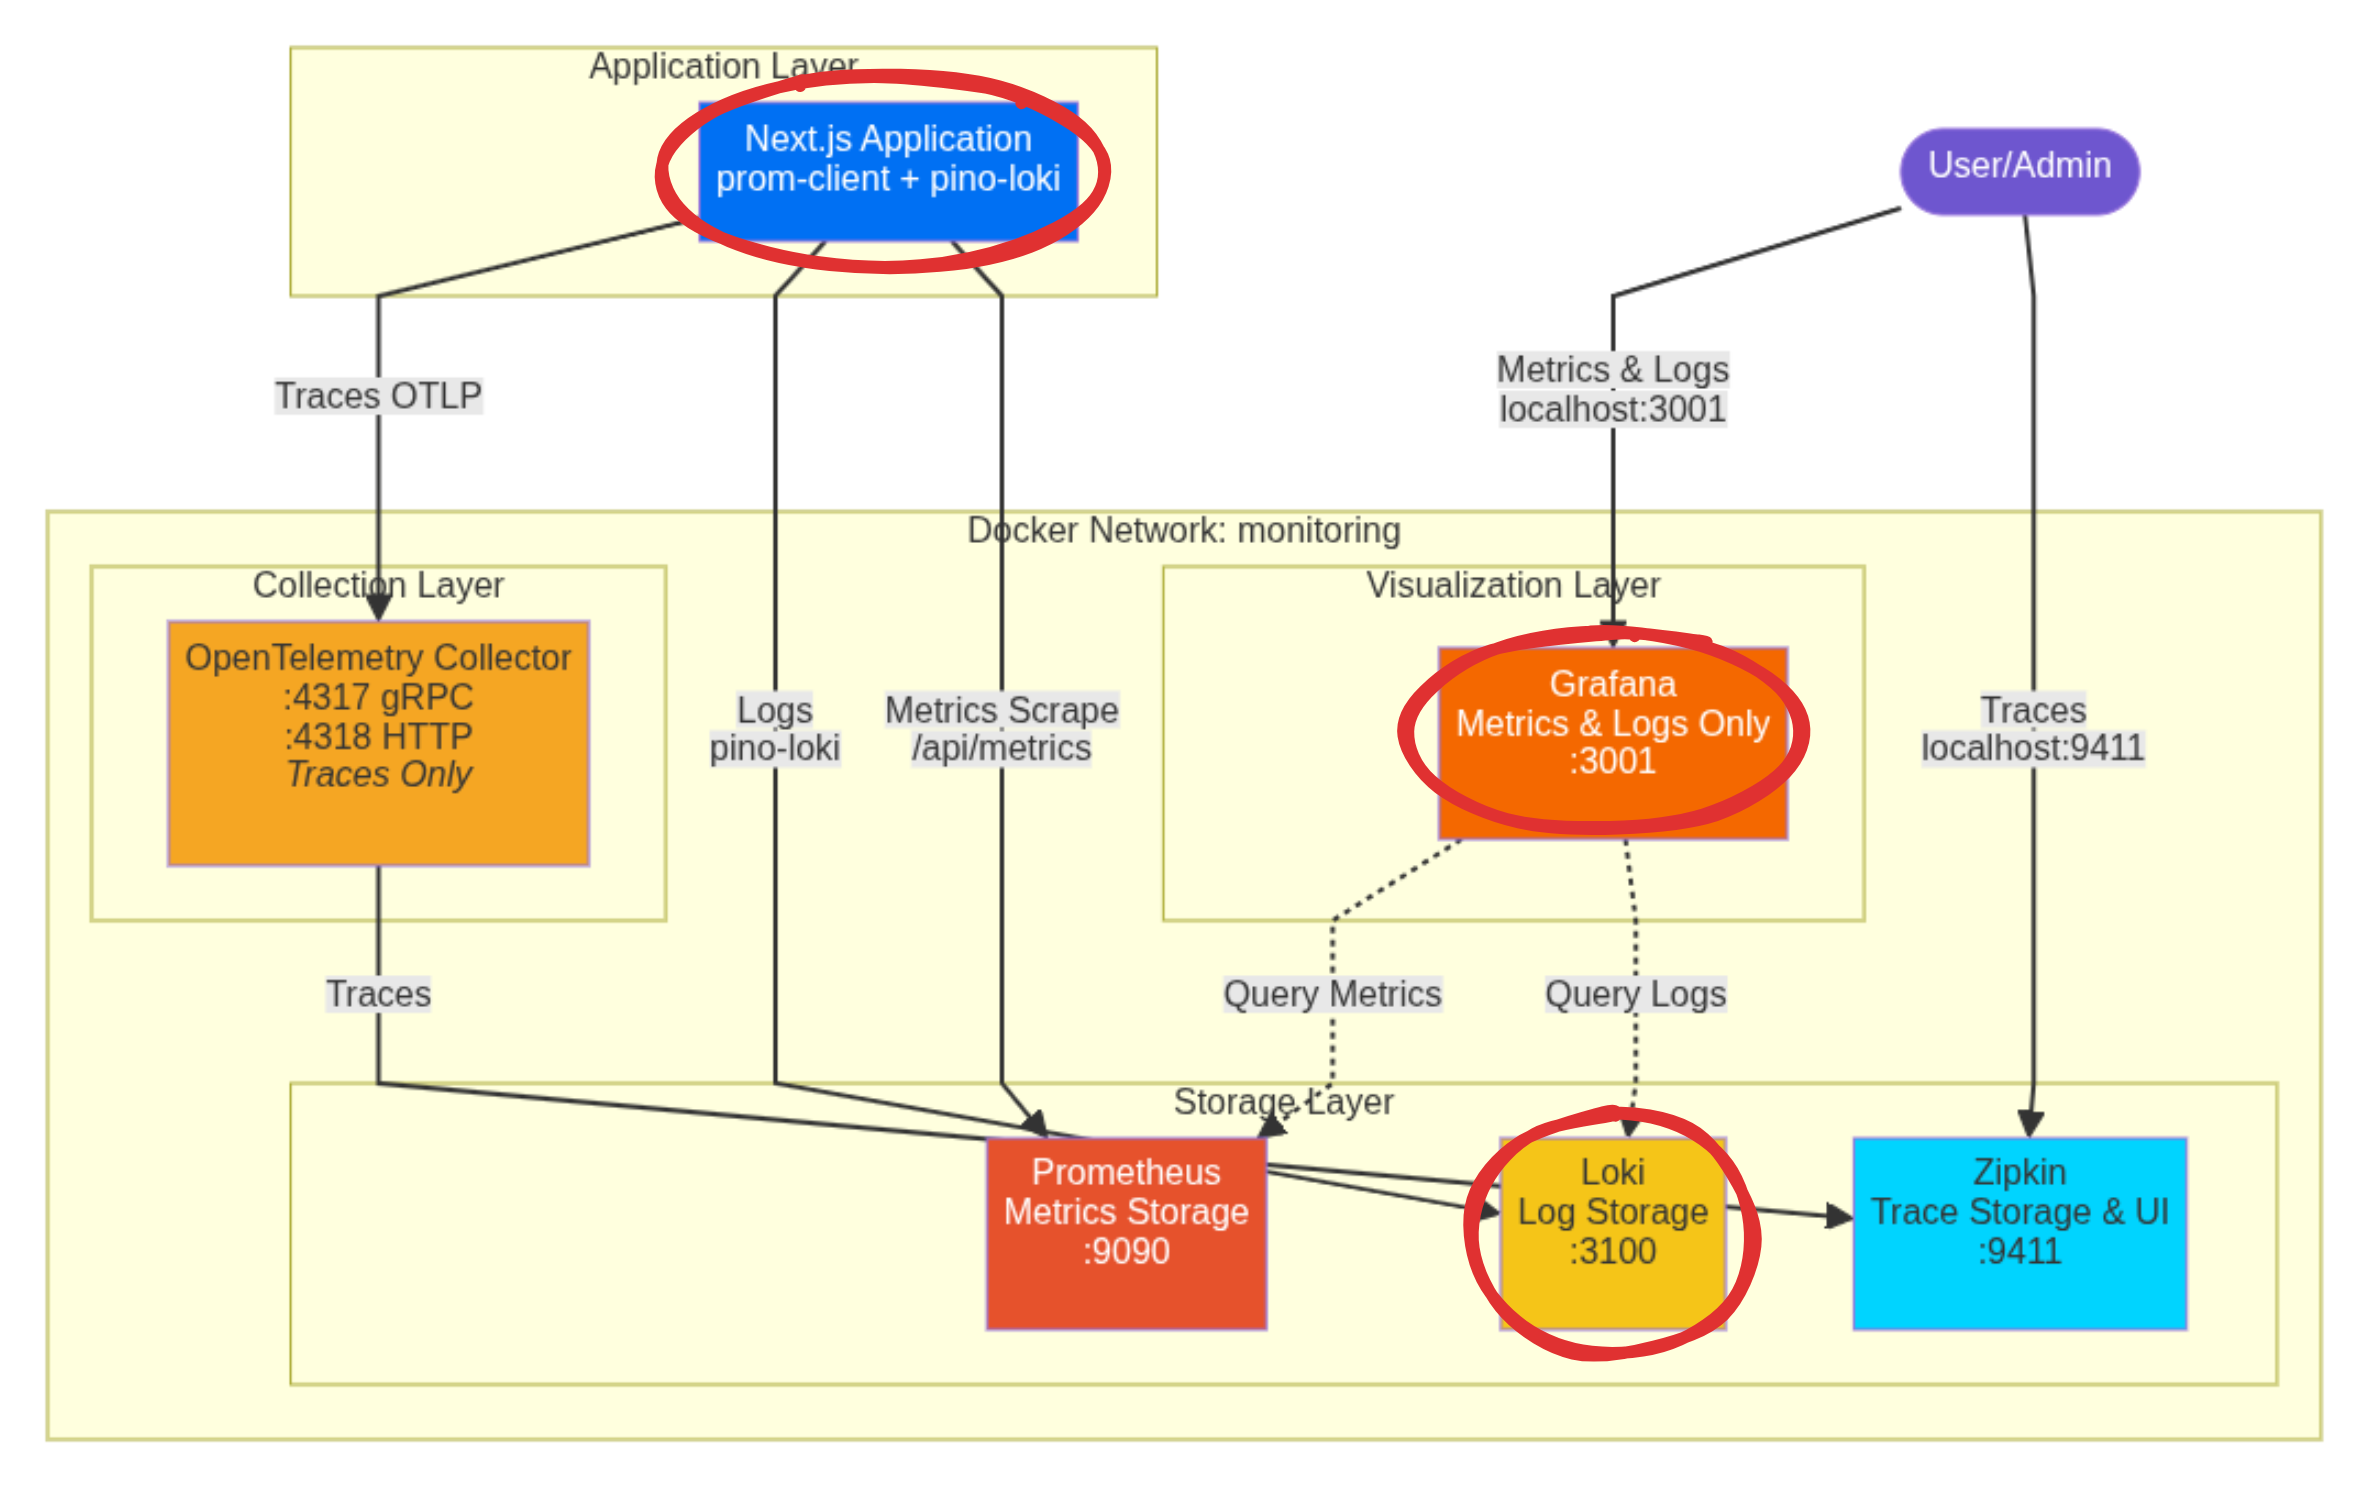
Blog Focus: The Logs
We will focus on implementing logs collection:
Pino and pino-loki
- pino is a very low overhead JavaScript logger.
- pino-loki is a transport layer that takes the formatted logs and ships them directly to our running Loki instance.
To install them run pnpm add pino pino-loki.
Next.js Instrumentation: Initializing the logger
In the same src/instrumentation.ts where we declared the metric registry on the previous blog
, we will also initialize the logger and make it globally available using globalThis.metrics.
// Based of https://github.com/adityasinghcodes/nextjs-monitoring/blob/main/instrumentation.ts
// Node.js-specific imports are moved into dynamic imports within runtime checks
// Prevent Edge runtime from trying to import Node.js-specific modules
declare global {
    var metrics:
        | {
        registry: any;
    }
        | undefined;
    var logger: any | undefined;
}

export async function register() {
    if (process.env.NEXT_RUNTIME === "nodejs") {
        const { Registry, collectDefaultMetrics } = await import("prom-client");
        const pino = (await import("pino")).default;
        const pinoLoki = (await import("pino-loki")).default;

        //Prom-client initialization
        const prometheusRegistry = new Registry();
        collectDefaultMetrics({
            register: prometheusRegistry,
        });
        globalThis.metrics = {
            registry: prometheusRegistry,
        };

        //logger initialization
        globalThis.logger = pino(
            pinoLoki({
                host: "http://localhost:3100", // Connects to the loki container via localhost:3100
                batching: true,
                interval: 5,
                labels: { app: "next-app" }, // Crucial label for querying in Grafana
            })
        );
    }
}
Logger Demonstration
Now that the logger is initialized globally, let’s create two simple API routes to demonstrate successful logging and error logging. We ensure these routes explicitly use the nodejs runtime to guarantee access to the instrumentation setup.
We’ll define /api/hello-world (always 200) and /api/something-is-wrong (always 500).
1. Success Route
// Based of https://github.com/adityasinghcodes/nextjs-monitoring/blob/main/app/api/examples/logging/route.ts
export const runtime = "nodejs";

export async function GET() {
    try {
        const { randomUUID } = await import("crypto");

        globalThis?.logger?.info({
            meta: {
                requestId: randomUUID(),
                extra: "This is some extra information that you can add to the meta",
                anything: "anything",
            },
            message: "Successful request handled",
        });
        return Response.json({
            message: "Hello world",
        });
    } catch (error) {
        globalThis?.logger?.error({
            err: error,
            message: "Something went wrong during success logging",
        });
    }
}
2. Failure Route
// Based of https://github.com/adityasinghcodes/nextjs-monitoring/blob/main/app/api/examples/logging/route.ts
export const runtime = "nodejs";

export async function GET() {
    try {
        throw new Error("Something is fundamentally wrong with this API endpoint");
    } catch (error) {
        globalThis?.logger?.error({
            err: error,
            message: "An error message here",
        });
        return new Response(JSON.stringify({ error: 'Internal Server Error' }), { status: 500 });
    }
}
loki Configuration
For Loki to receive and correctly store the logs shipped by pino-loki, we need to provide it with a configuration file that dictates storage, retention, and endpoints.
We place this configuration in src/resources/dev/monitoring/loki-config.yml:
# Based of https://github.com/adityasinghcodes/nextjs-monitoring/blob/main/loki-config.yml
# Disable authentication (NOT recommended for production)
auth_enabled: false

# Server configuration
server:
  # Port where Loki will listen for incoming connections
  http_listen_port: 3100

# Common configuration settings
common:
  # Base directory for Loki's data storage
  path_prefix: /tmp/loki
  # Storage configuration - using local filesystem
  storage:
    filesystem:
      # Directory where Loki stores data chunks
      chunks_directory: /tmp/loki/chunks
  # Number of copies of each stream to maintain (1 for single instance)
  replication_factor: 1
  # Ring is Loki's internal coordination system
  ring:
    # Key-Value store configuration for ring
    kvstore:
      # Using in-memory storage (good for testing, NOT for production)
      store: inmemory

# Schema configuration defines how Loki organizes and stores log data
schema_config:
  configs:
    - from: 2020-10-24
      # Using TSDB (Time Series Database) storage format
      store: tsdb
      # Using local filesystem for object storage
      object_store: filesystem
      # Schema version
      schema: v13
      # Index configuration
      index:
        # Prefix for index files
        prefix: index_
        # Create new index files every 24 hours
        period: 24h

limits_config:
  # Keep logs for 28 days before deletion
  retention_period: 672h

ruler:
  storage:
    type: local
    local:
      directory: /loki/rules
# NOTE: This configuration is suitable for development/testing only.
# For production, you should:
# 1. Enable authentication
# 2. Use persistent storage instead of filesystem
# 3. Use external kvstore (like etcd or consul) instead of inmemory
# 4. Use proper persistent directory instead of /tmp
Define loki Docker Service
In the same Docker Compose we used to define the Prometheus backend and the Grafana visualization layer on the previous blog , we will also define loki.
src/resources/dev/monitoring/docker-compose.yml
# Based of https://github.com/adityasinghcodes/nextjs-monitoring/blob/main/docker-compose.yml
services:
  grafana:
    container_name: grafana
    image: grafana/grafana:11.4.0
    ports:
      - "3001:3000"
    environment:
      - GF_SECURITY_ADMIN_USER=admin_user
      - GF_SECURITY_ADMIN_PASSWORD=admin_password
    volumes:
      - grafana-storage:/var/lib/grafana
    networks:
      - monitoring

  prometheus:
    container_name: prometheus
    image: prom/prometheus:v3.0.1
    ports:
      - "9090:9090"
    volumes:
      - ./prometheus.yml:/etc/prometheus/prometheus.yml
      - prometheus-storage:/prometheus
    networks:
      - monitoring

  loki:
    container_name: loki
    image: grafana/loki:2.9.2
    ports:
      - "3100:3100"
    volumes:
      - ./loki-config.yml:/etc/loki/local-config.yml
    command: -config.file=/etc/loki/local-config.yml
    networks:
      - monitoring

networks:
  monitoring:
    name: monitoring
    driver: bridge

volumes:
  grafana-storage:
  prometheus-storage:
Grafana Dashboard Setup
Make sure your Docker engine (like Docker Desktop ) is running in the background.
- Start the Stack:
docker-compose -f src/resources/dev/monitoring/docker-compose.yml up -d - Start the App: Run your Next.js application’s start script on the host machine.
Go to http://localhost:3001/
and log in using the credentials defined in the docker-compose.yml (admin_user/admin_password).
Add Loki Data Source
- Go to
http://localhost:3001/connections/datasources/newand select Loki.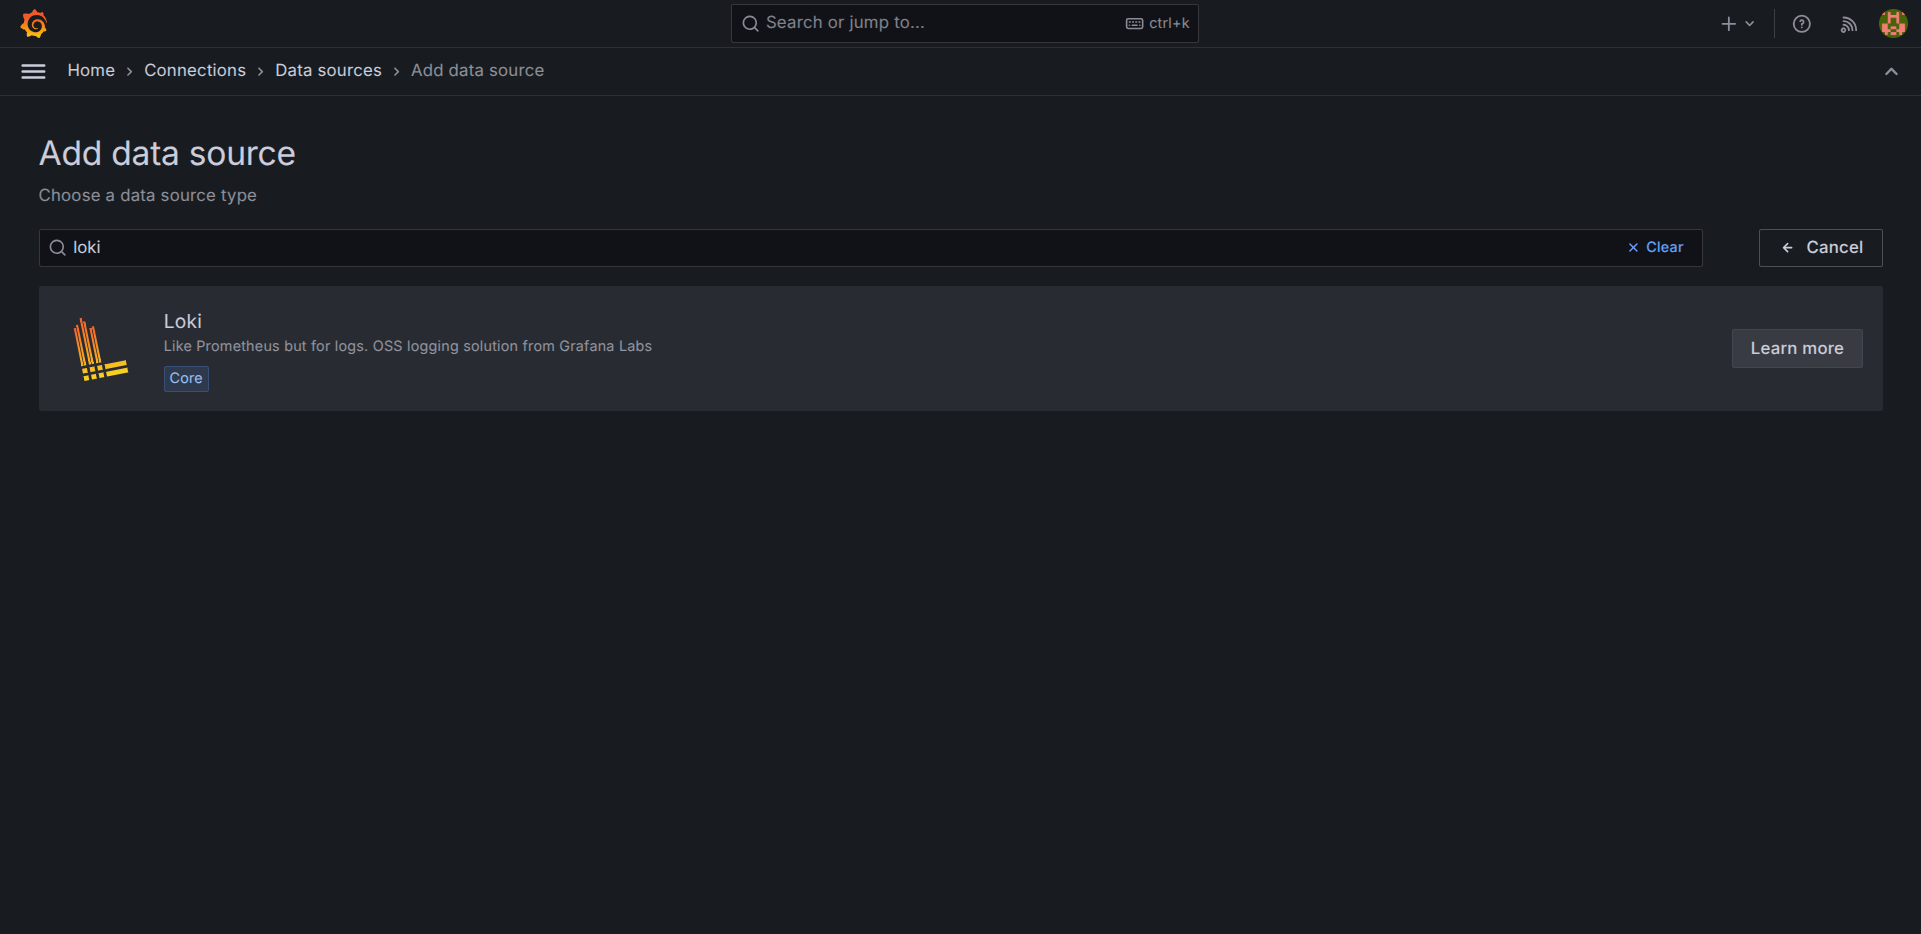
- Set the “Connection URL” to
http://loki:3100(We use the Docker service name,loki).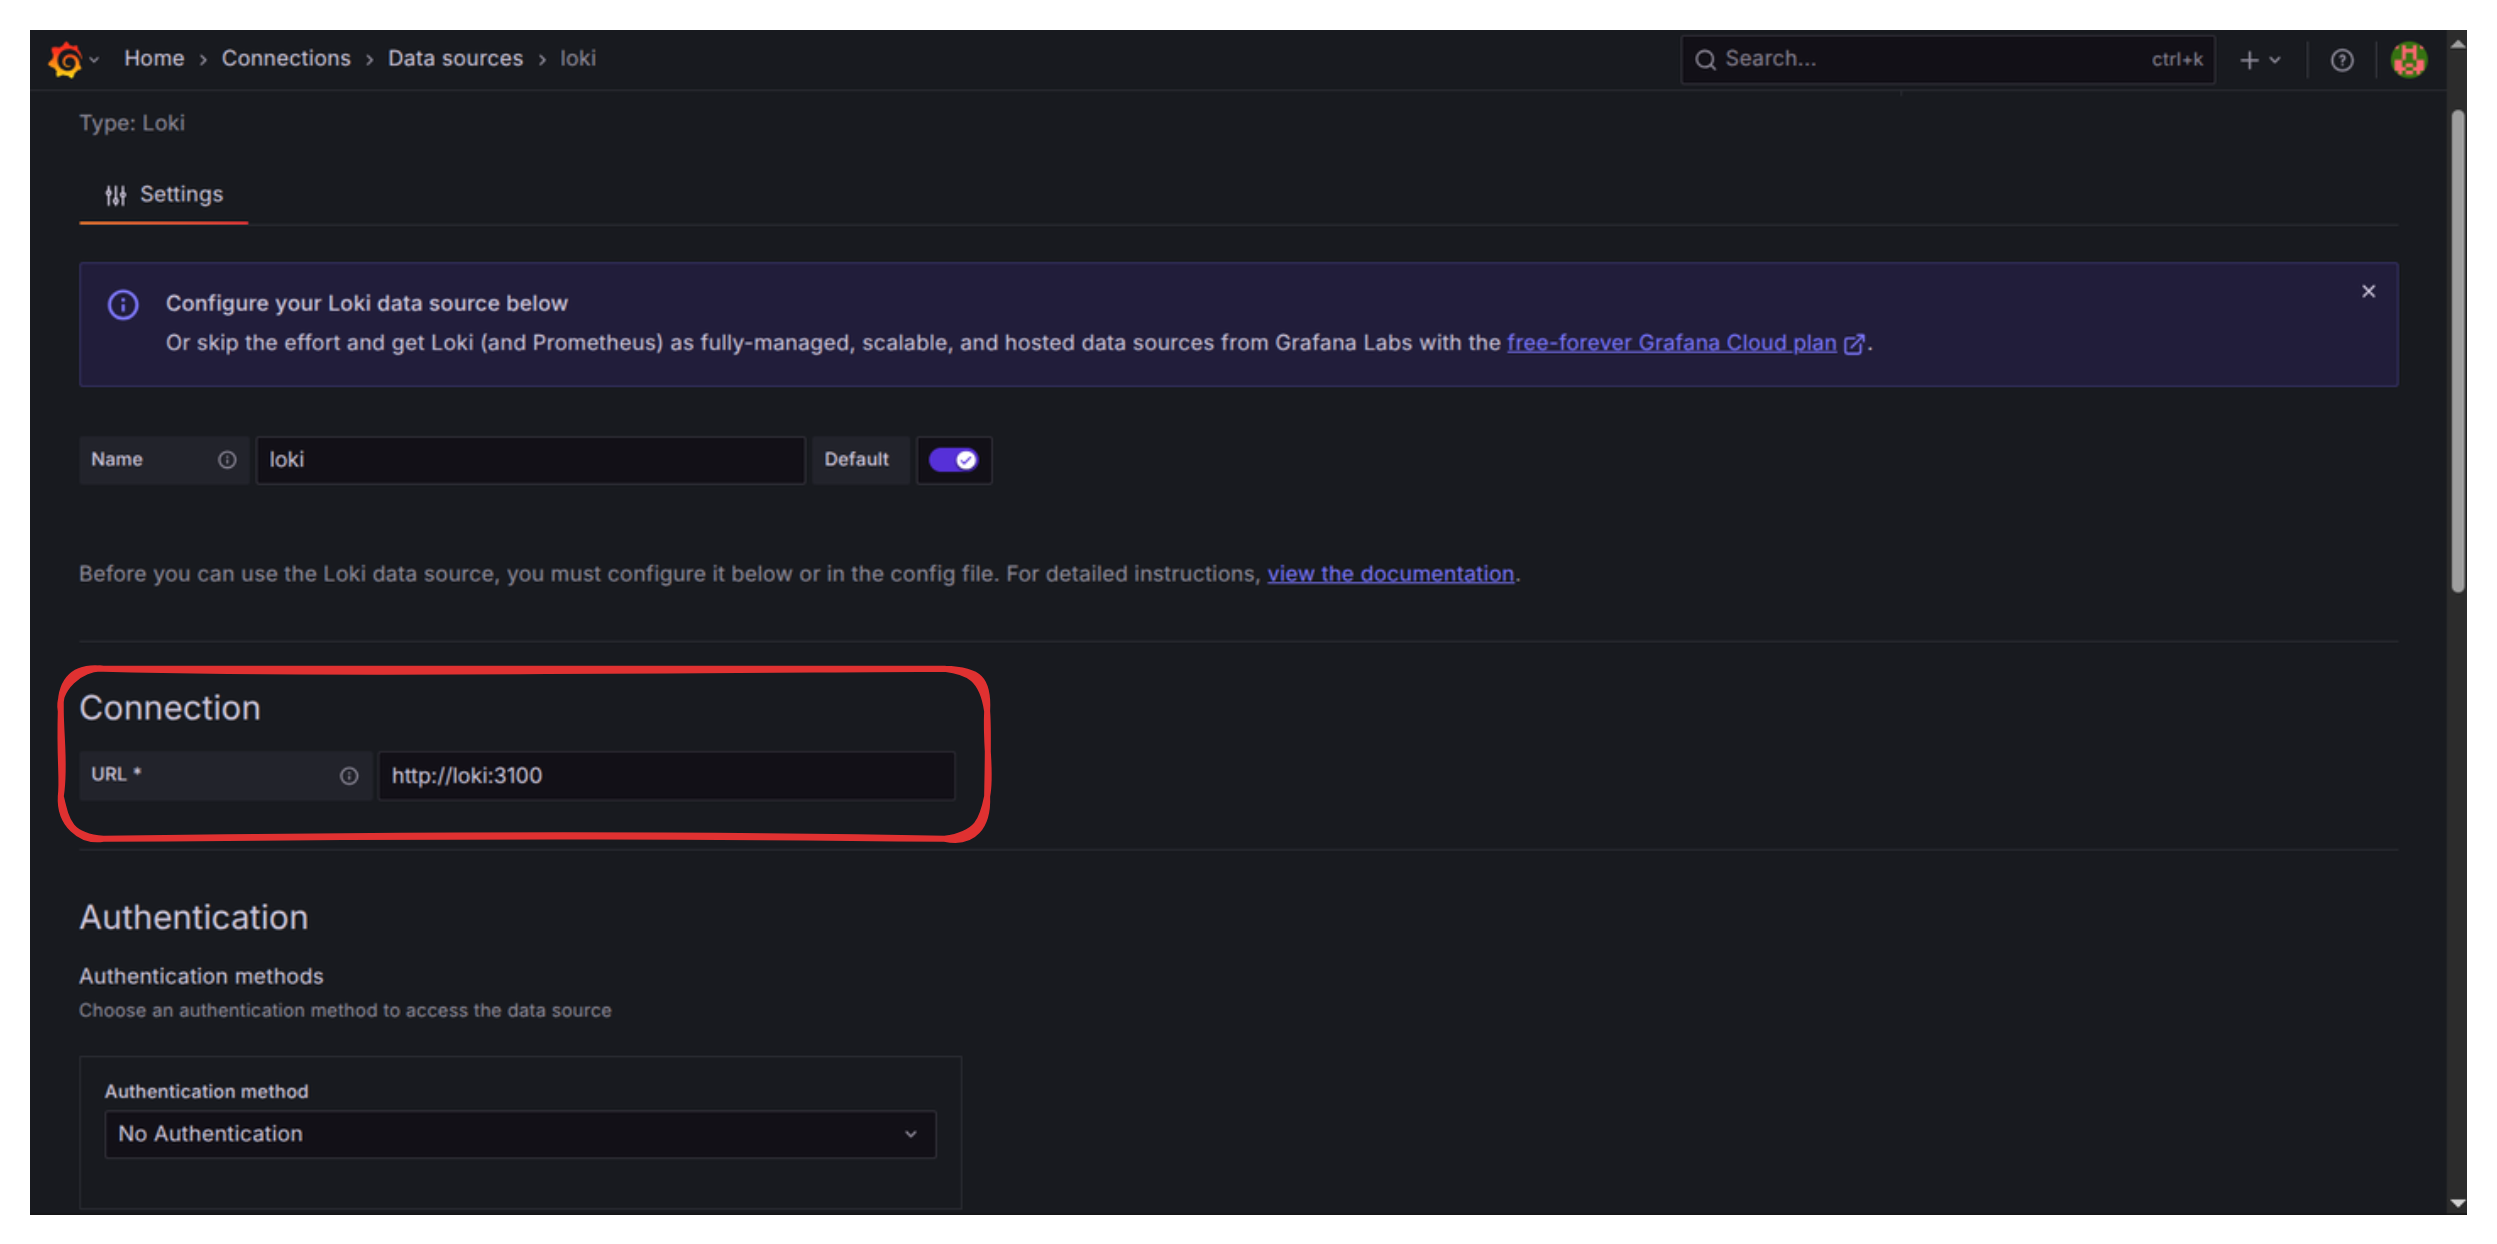
- Scroll down and click “Save & Test.” You should see “Data source successfully connected.”
- Go to http://localhost:3001/dashboards
and select the dashboard we created in the previous blog.
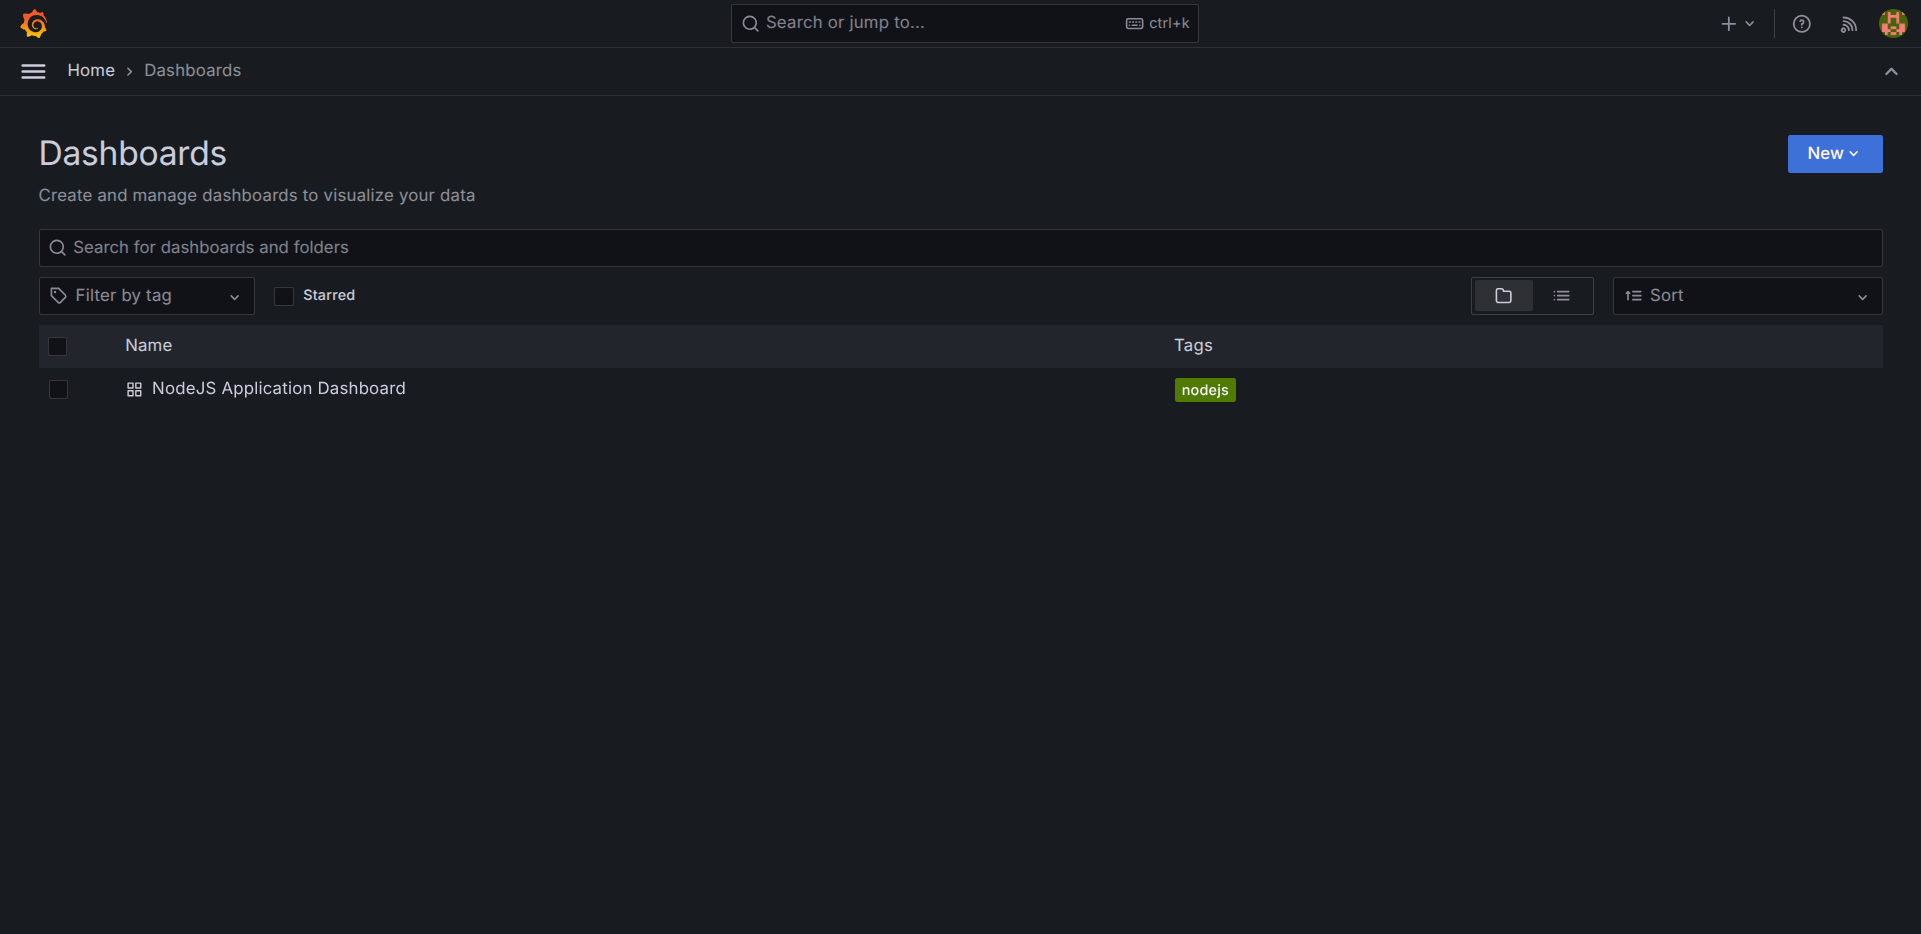
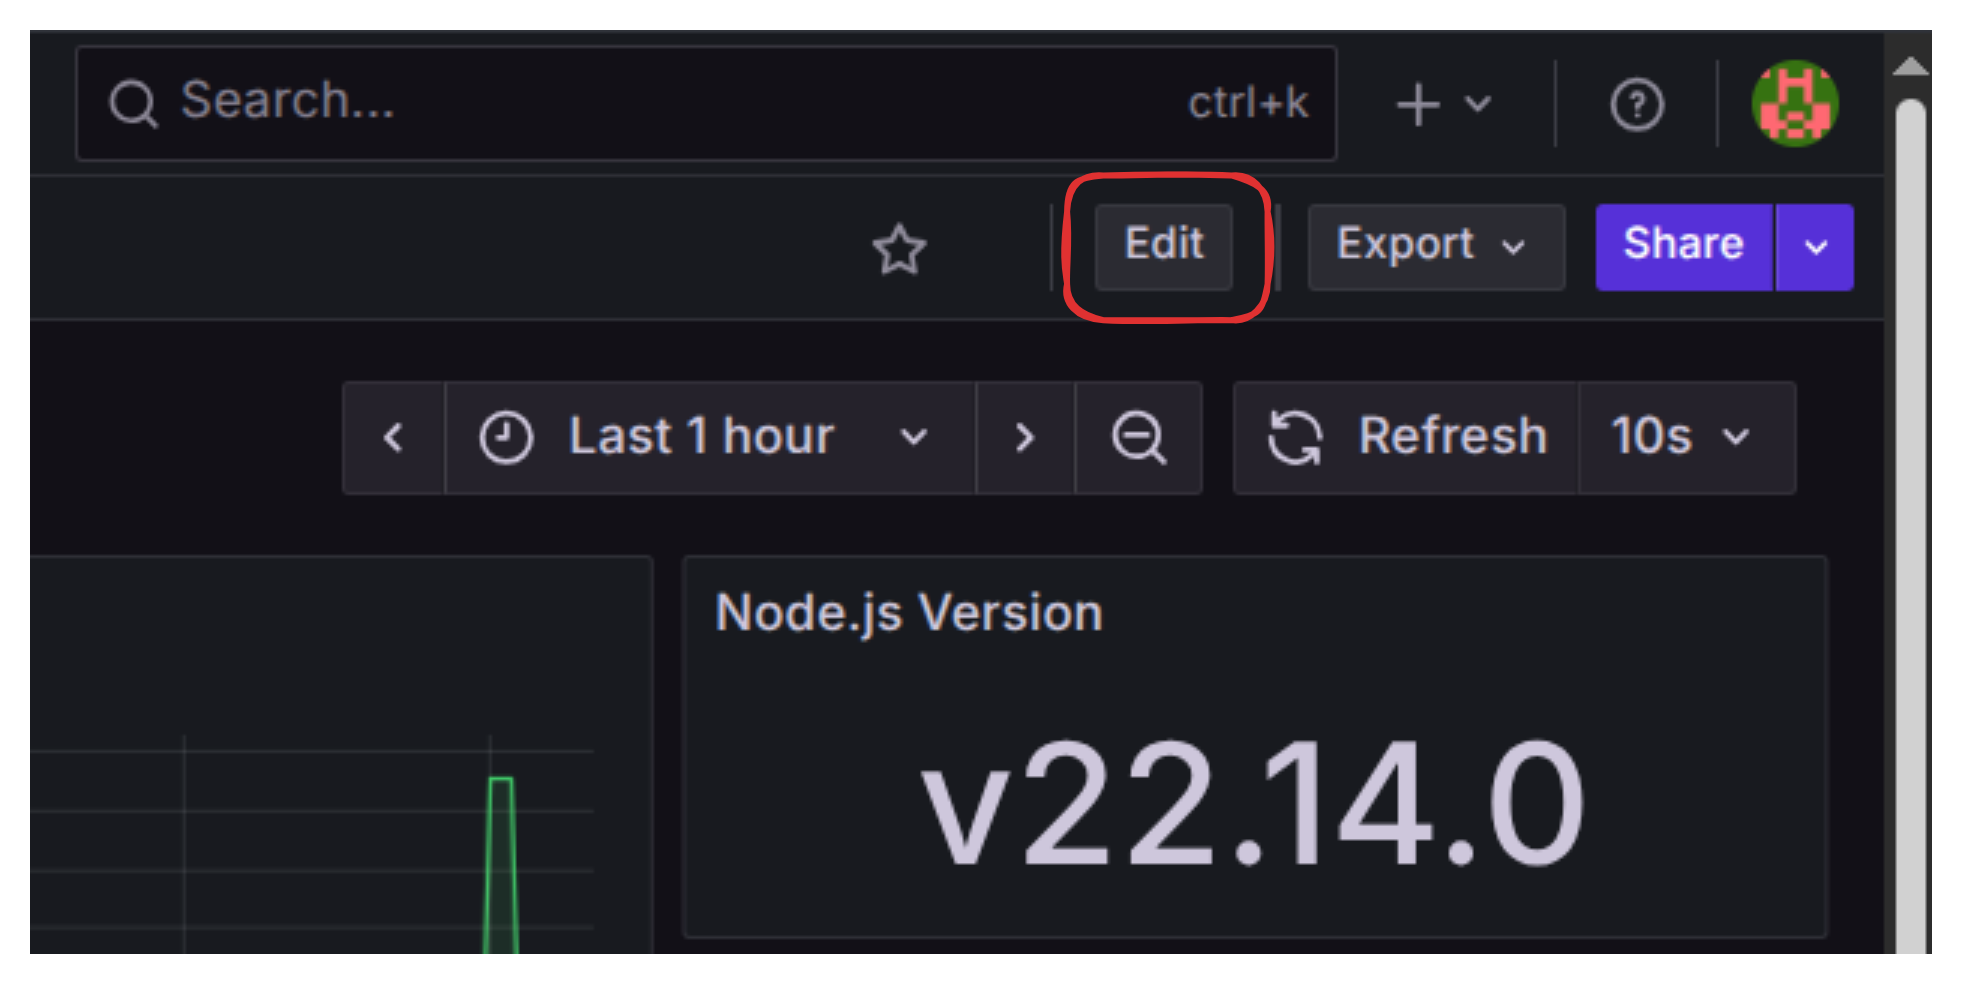
- Click Edit (top right) to enter Edit mode.
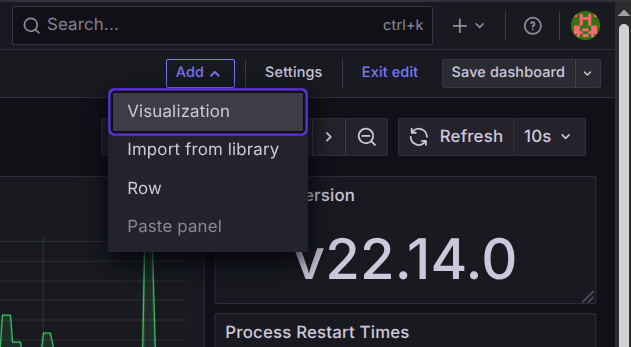
- Click on the “Add” dropdown and select “Visualization.”
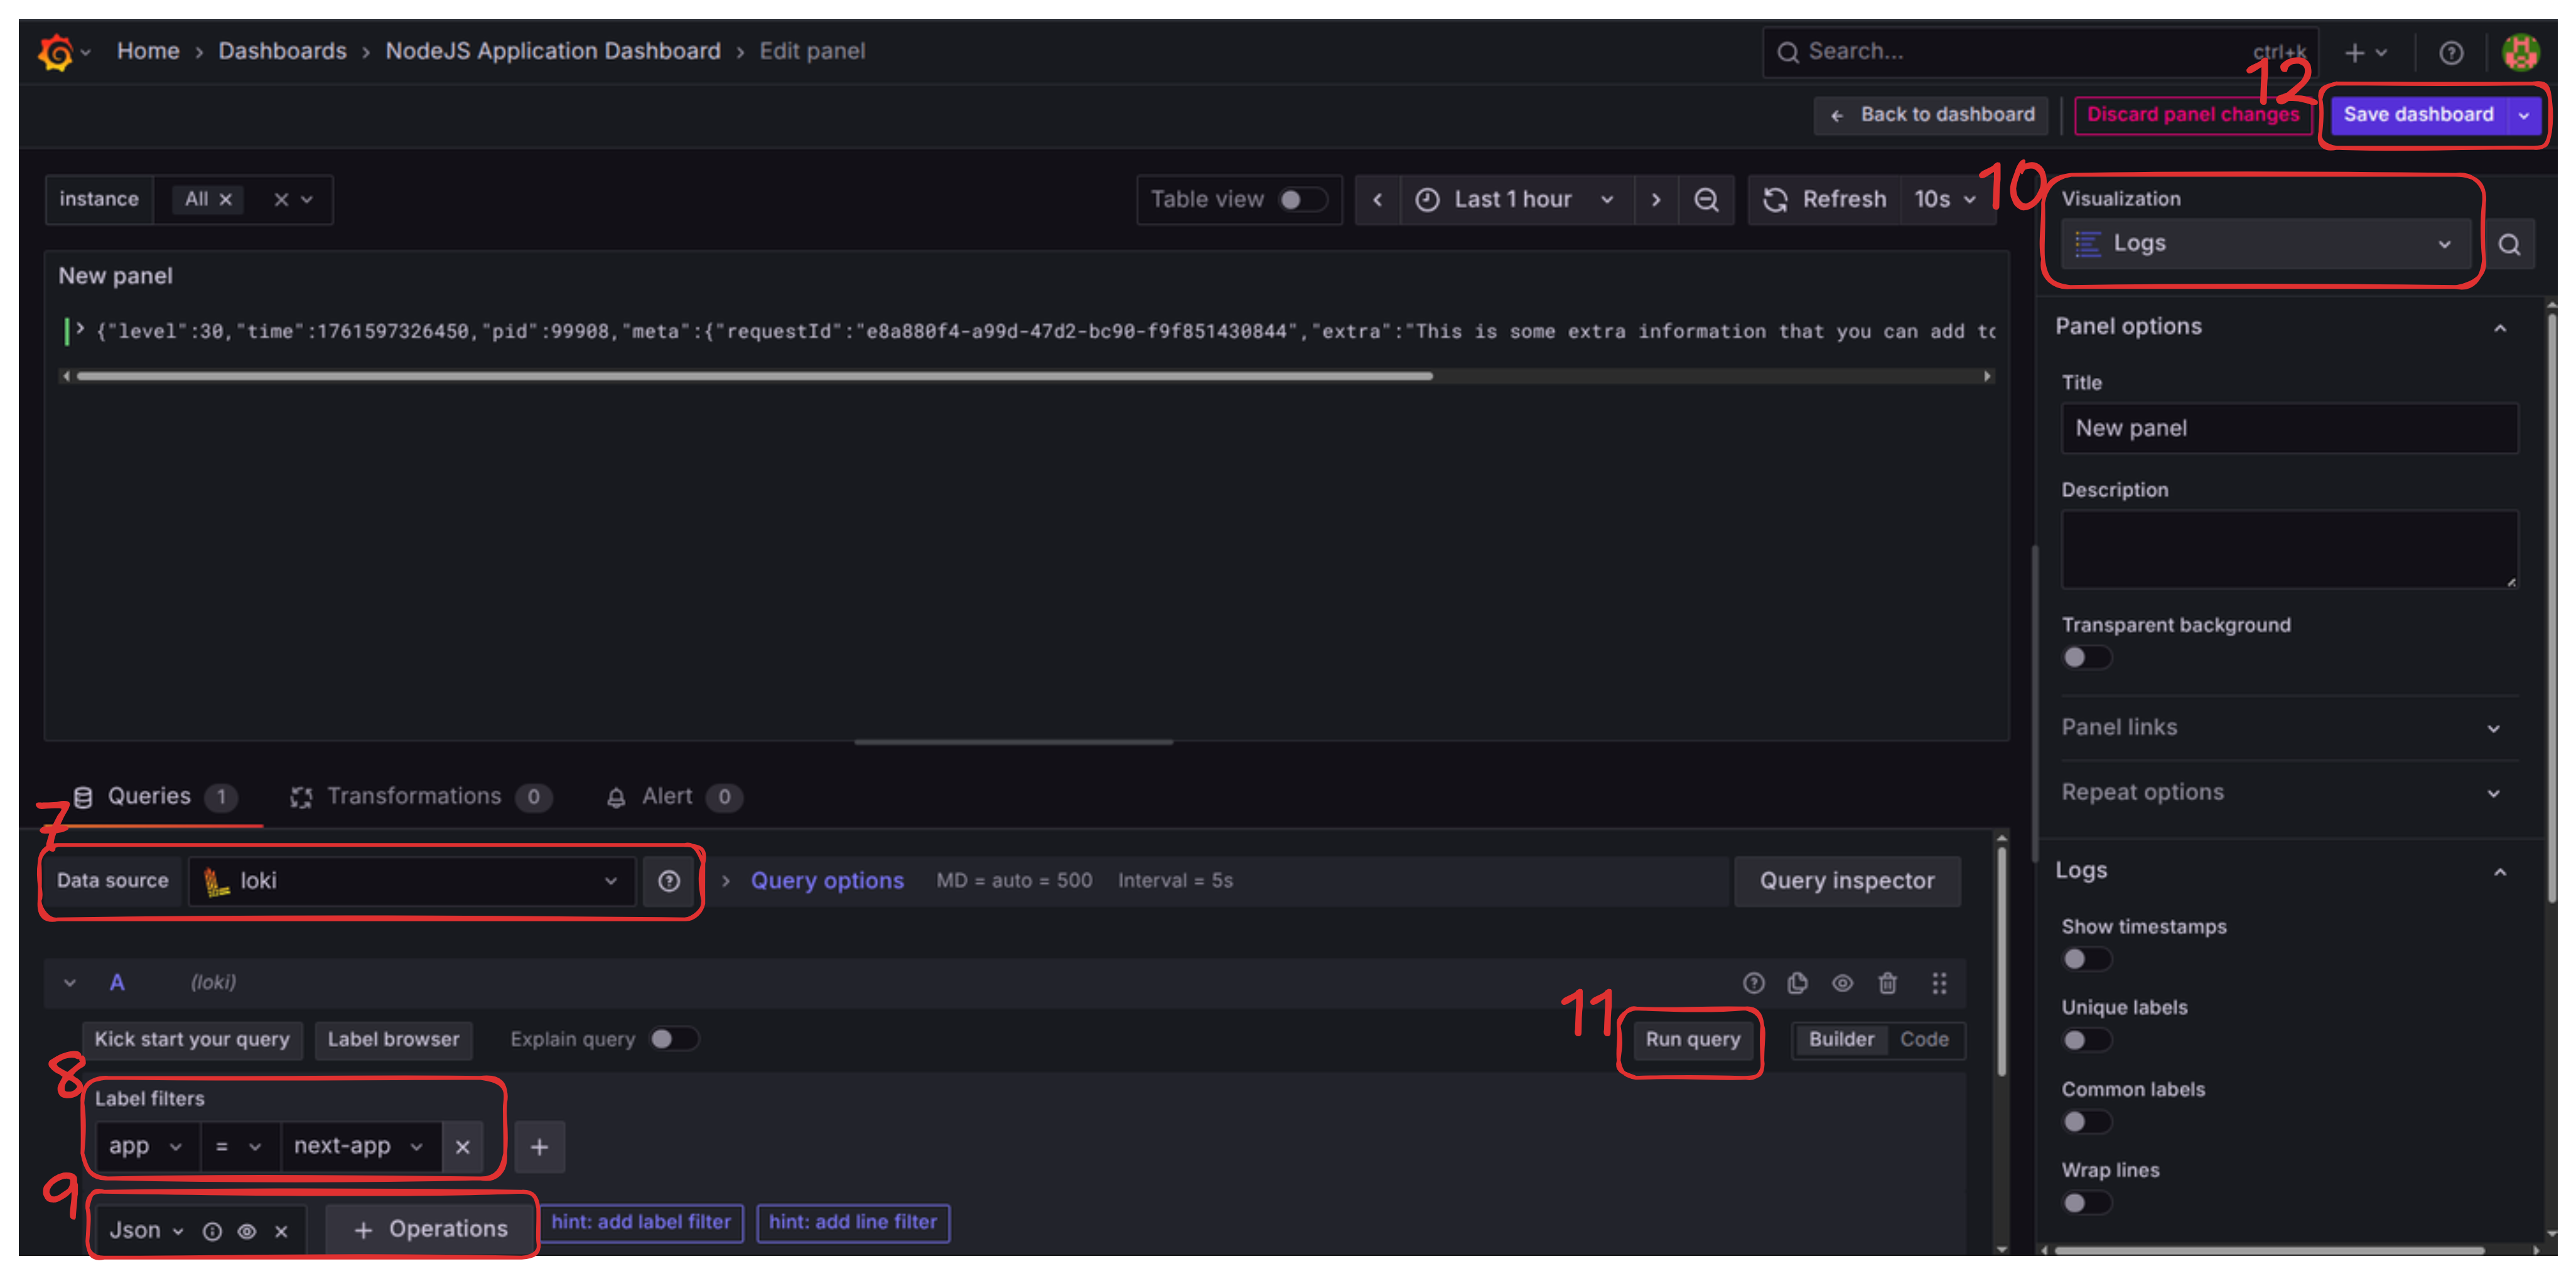
- Select loki as the data source.
- In the “label filters,” select the label
appand the valuenext-app(this is the label we defined in ourinstrumentation.ts).- Note: If these values aren’t available, make sure you ran the
docker-composeservices and hit the API routes a few times to generate data.
- Note: If these values aren’t available, make sure you ran the
- In “operations,” clear the default operation, and select Add JSON Parser (since
pinooutputs JSON logs). - On the right sidebar, change the “Visualization” type to Logs.
- Click “Run query” to confirm the data appears.
- Save the Dashboard.
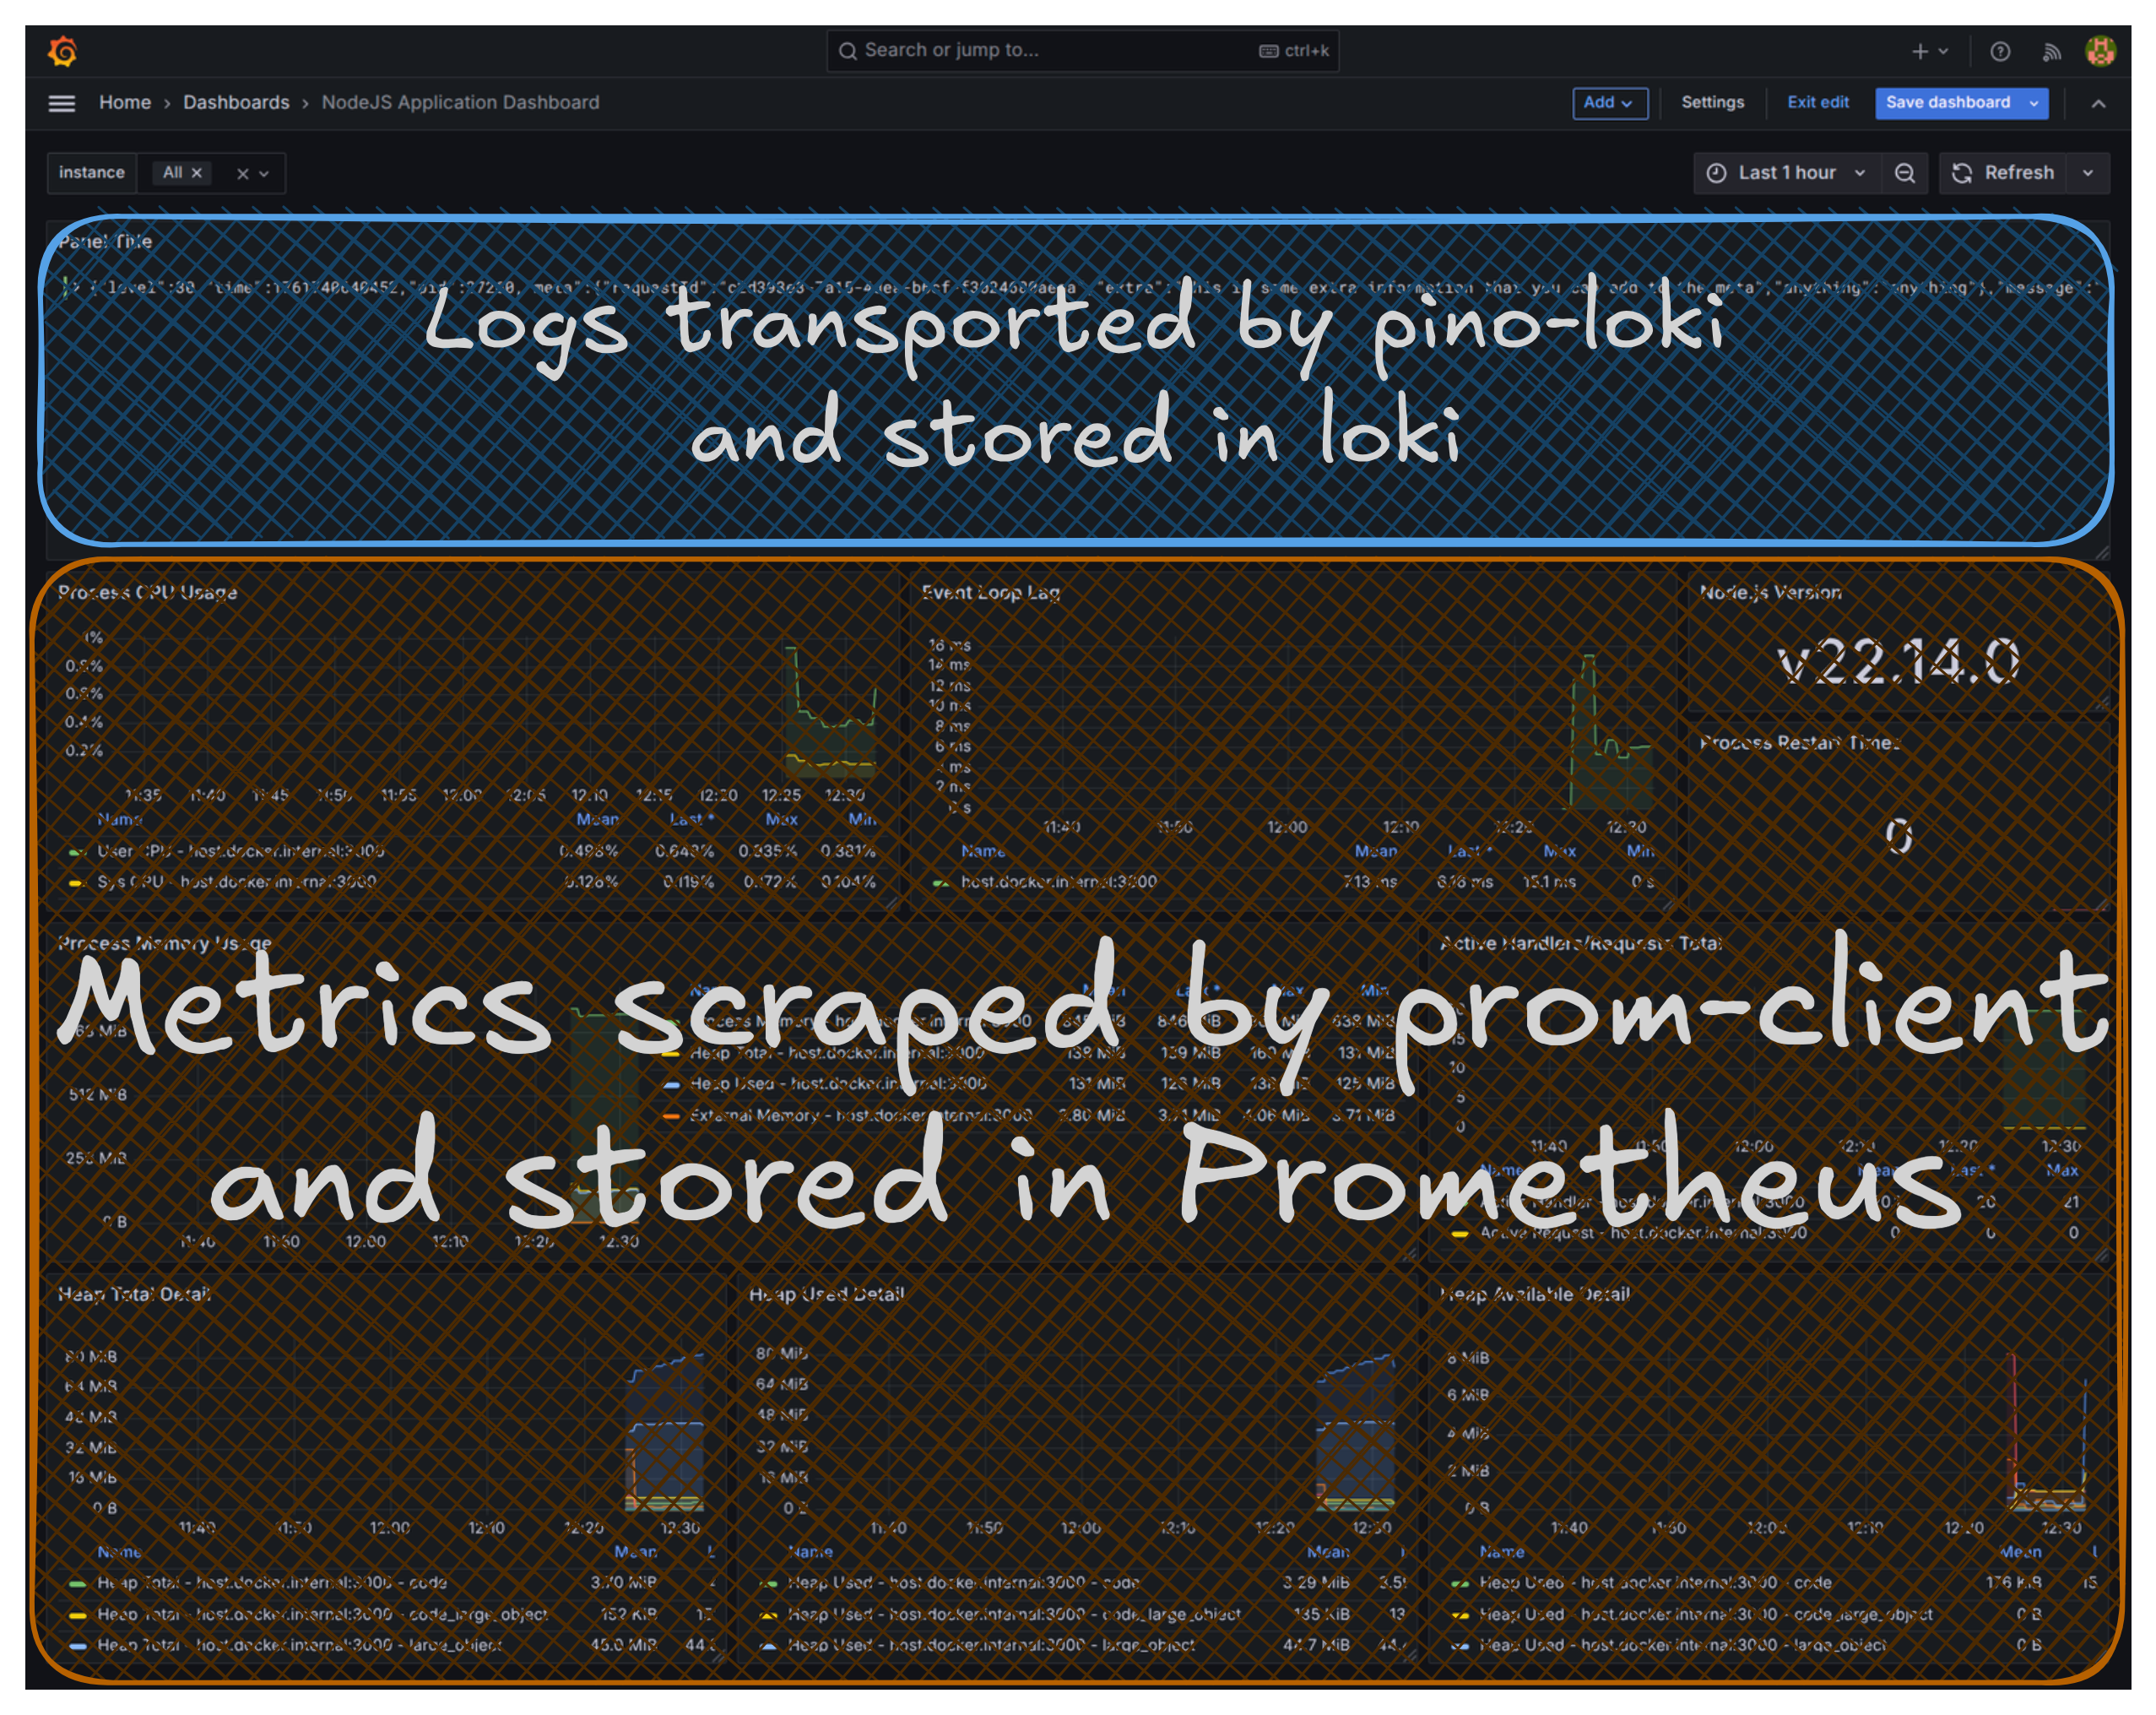
You can now drag and resize the new log panel.
Congratulations, you have a unified monitoring dashboard displaying both metrics and application logs! (Don’t forget to save the dashboard).
What’s Next?
In the next blog we will set up tracing with an OTel collector and Zipkin.
Next Blog: Large Software Projects: Collecting Traces