
Large Software Projects: Collecting Traces
Posted on October 28, 2025 • 6 minutes • 1163 words • Other languages: Español
This post is part of my Large Software Projects blog series .
- Code Source
- Blog Focus: The Traces
- OpenTelemetry Libraries
- Next.js Instrumentation: Registering OpenTelemetry
- OTel Environment Variables Setup
- OTel Collector Configuration
- Define OTel Collector and Zipkin
- Trace Visualization with Zipkin
- Troubleshooting the Production Error
- What’s Next?
Code Source
All code snippets shown in this post are available in the dedicated branch for this article on the project’s GitHub repository. Feel free to clone it and follow along:
https://github.com/franBec/tas/tree/feature/2025-10-28
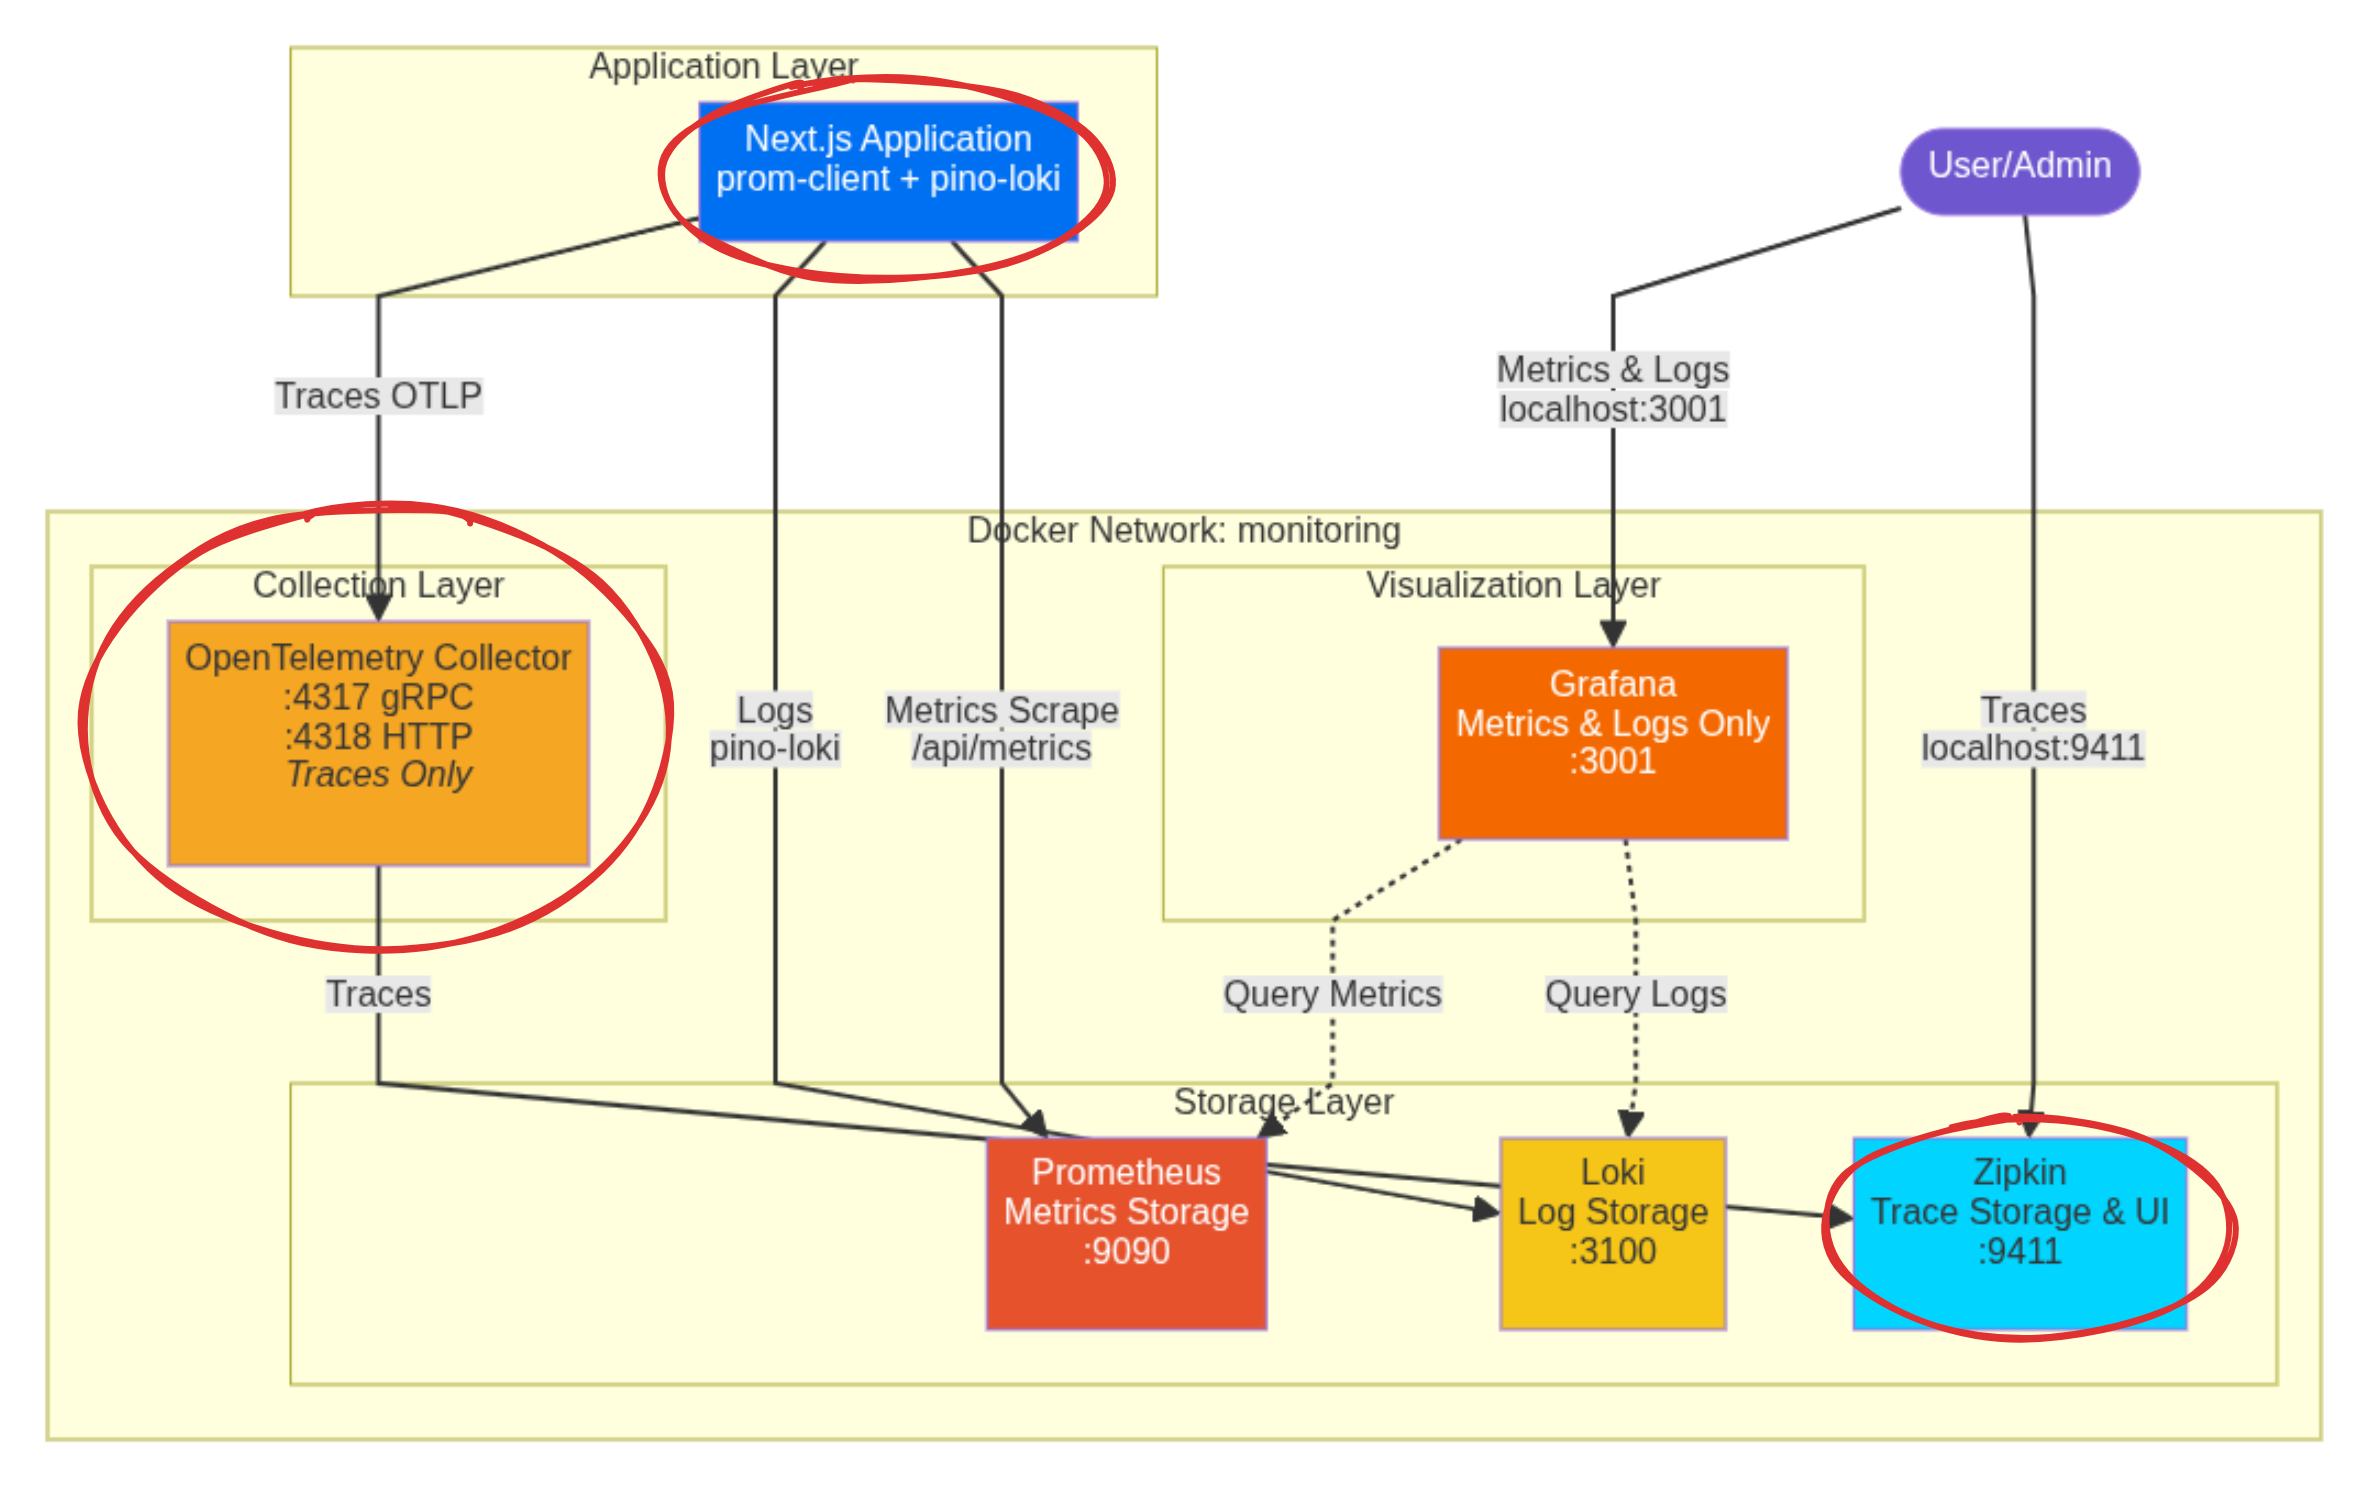
Blog Focus: The Traces
We will focus on implementing trace collection:
OpenTelemetry Libraries
We need to install the following packages:
@vercel/otel: This is Vercel’s official OpenTelemetry distribution library for Next.js, making tracing and span creation simple within the framework.@opentelemetry/sdk-logs/@opentelemetry/api-logs/@opentelemetry/instrumentation: The foundational OpenTelemetry components needed to set up a proper tracing and logging ecosystem.
To install them run pnpm add @vercel/otel @opentelemetry/sdk-logs @opentelemetry/api-logs @opentelemetry/instrumentation.
Next.js Instrumentation: Registering OpenTelemetry
In the same src/instrumentation.ts where we initialized the logger on the previous blog
, we will also register OpenTelemetry.
// Based of https://github.com/adityasinghcodes/nextjs-monitoring/blob/main/instrumentation.ts
// Node.js-specific imports are moved into dynamic imports within runtime checks
// Prevent Edge runtime from trying to import Node.js-specific modules
declare global {
    var metrics:
        | {
        registry: any;
    }
        | undefined;
    var logger: any | undefined;
}

export async function register() {
    if (process.env.NEXT_RUNTIME === "nodejs") {
        const { Registry, collectDefaultMetrics } = await import("prom-client");
        const pino = (await import("pino")).default;
        const pinoLoki = (await import("pino-loki")).default;
        const { registerOTel } = await import("@vercel/otel");

        //prometheus initialization
        const prometheusRegistry = new Registry();
        collectDefaultMetrics({
            register: prometheusRegistry,
        });
        globalThis.metrics = {
            registry: prometheusRegistry,
        };

        //loki initialization
        globalThis.logger = pino(
            pinoLoki({
                host: "http://localhost:3100", // Connects to the loki container via localhost:3100
                batching: true,
                interval: 5,
                labels: { app: "next-app" }, // Crucial label for querying in Grafana
            })
        );

        //otel initialization
        registerOTel();
    }
}
OTel Environment Variables Setup
For the OpenTelemetry instrumentation to know where to send its data and how to label it, we need to set specific environment variables.
Since we are running the Next.js application outside of Docker, these variables must be defined on the host machine environment where the Next.js process starts.
Setting up the Host Environment
-
IDE Run/Debug Configuration: If you use an IDE like JetBrains WebStorm , you can add these variables directly to the Run/Debug configuration options:
Set the following environment string:
OTEL_LOG_LEVEL=info;OTEL_SERVICE_NAME="next-app"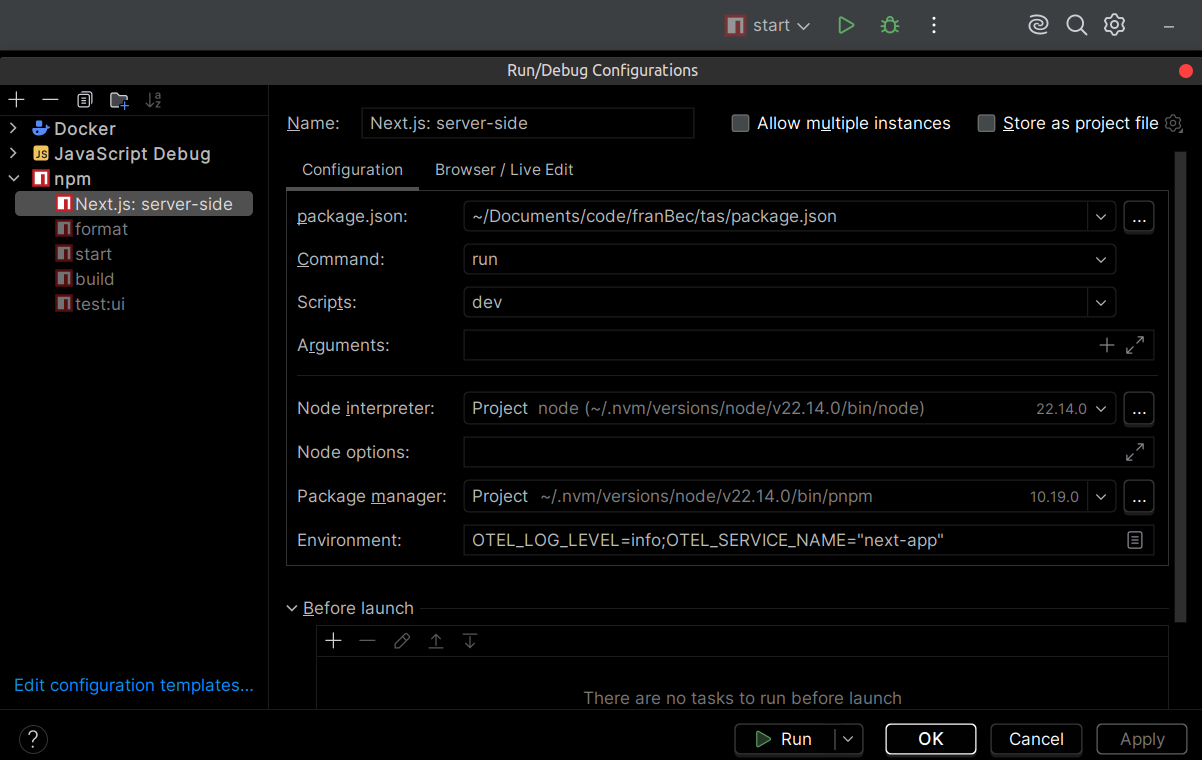
Pragmatic Tip: It is highly recommended to save all your non-sensitive development environment variables in a text file (e.g.,
src/resources/dev/env-dev.txt) so new developers can easily copy-paste them into their IDE setup. -
Project
.envfile: We use the project.envfile to reference these environment variables, making them available to the Next.js build and runtime process.
# OTel Configuration
OTEL_LOG_LEVEL="${OTEL_LOG_LEVEL}"
OTEL_SERVICE_NAME="${OTEL_SERVICE_NAME}"
OTel Collector Configuration
Tracing is managed by OpenTelemetry (OTel). Our Next.js app, via @vercel/otel, sends trace data using the OTLP protocol to an intermediary service: the OpenTelemetry Collector.
The Collector acts as a central hub, receiving the data, processing it (like batching it efficiently), and then routing it to the final backend—in this case, Zipkin.
The configuration for the collector is in src/resources/dev/monitoring/otel-collector-config.yml:
# Based of https://github.com/adityasinghcodes/nextjs-monitoring/blob/main/otel-collector-config.yml
# Receivers configuration - defines how the collector receives telemetry data
receivers:
  # OpenTelemetry Protocol (OTLP) receiver configuration
  otlp:
    protocols:
      # gRPC endpoint for receiving OTLP data
      grpc:
        endpoint: "0.0.0.0:4317"
      # HTTP endpoint for receiving OTLP data
      http:
        endpoint: "0.0.0.0:4318"

# Processors configuration - defines how telemetry data is processed
processors:
  # Batch processor aggregates data before exporting
  batch:
    timeout: 1s # Maximum time to wait before sending a batch
    send_batch_size: 1024 # Maximum number of spans to include in a batch

# Exporters configuration - defines where telemetry data is sent
exporters:
  # Zipkin exporter configuration
  zipkin:
    endpoint: "http://zipkin:9411/api/v2/spans" # Zipkin server endpoint (using the service name 'zipkin')
    format: proto # Use protobuf format for data
  # Debug exporter for troubleshooting
  debug:
    verbosity: detailed # Maximum verbosity level for debugging

# Extensions configuration - additional collector functionality
extensions:
  health_check: # Enables health checking endpoint
  pprof: # Enables profiling endpoint
    endpoint: :1888
  zpages: # Enables diagnostic pages
    endpoint: :55679

# Service configuration - ties together all the components
service:
  extensions: [pprof, zpages, health_check] # Enable all configured extensions
  pipelines:
    # Traces pipeline configuration
    traces:
      receivers: [otlp] # Use OTLP receiver
      processors: [batch] # Process with batch processor
      exporters: [zipkin, debug] # Export to Zipkin and debug
Define OTel Collector and Zipkin
In the same Docker Compose we used to define loki on the previous blog , we will also define OTel Collector and Zipkin.
src/resources/dev/monitoring/docker-compose.yml
# Based of https://github.com/adityasinghcodes/nextjs-monitoring/blob/main/docker-compose.yml
services:
  grafana:
    container_name: grafana
    image: grafana/grafana:11.4.0
    ports:
      - "3001:3000"
    environment:
      - GF_SECURITY_ADMIN_USER=admin_user
      - GF_SECURITY_ADMIN_PASSWORD=admin_password
    volumes:
      - grafana-storage:/var/lib/grafana
    networks:
      - monitoring

  prometheus:
    container_name: prometheus
    image: prom/prometheus:v3.0.1
    ports:
      - "9090:9090"
    volumes:
      - ./prometheus.yml:/etc/prometheus/prometheus.yml
      - prometheus-storage:/prometheus
    networks:
      - monitoring

  loki:
    container_name: loki
    image: grafana/loki:2.9.2
    ports:
      - "3100:3100"
    volumes:
      - ./loki-config.yml:/etc/loki/local-config.yml
    command: -config.file=/etc/loki/local-config.yml
    networks:
      - monitoring

  otel-collector:
    container_name: otel-collector
    image: otel/opentelemetry-collector:0.115.0
    restart: always
    command: ["--config=/etc/otel-collector-config.yml"]
    volumes:
      - ./otel-collector-config.yml:/etc/otel-collector-config.yml
    ports:
      - "4317:4317" # OTLP gRPC receiver
      - "4318:4318" # OTLP HTTP receiver
      - "8888:8888" # Prometheus metrics exposed by collector
      - "8889:8889" # Prometheus exporter metrics
      - "13133:13133" # Health check extension
      - "55679:55679" # zPages extension
    networks:
      - monitoring

  zipkin:
    container_name: zipkin
    image: openzipkin/zipkin:3.4.2
    ports:
      - "9411:9411"
    networks:
      - monitoring

networks:
  monitoring:
    name: monitoring
    driver: bridge

volumes:
  grafana-storage:
  prometheus-storage:
Trace Visualization with Zipkin
Make sure your Docker engine (like Docker Desktop ) is running in the background.
- Start the Stack:
docker-compose -f src/resources/dev/monitoring/docker-compose.yml up -d - Start the App: Run your Next.js application’s start script on the host machine.
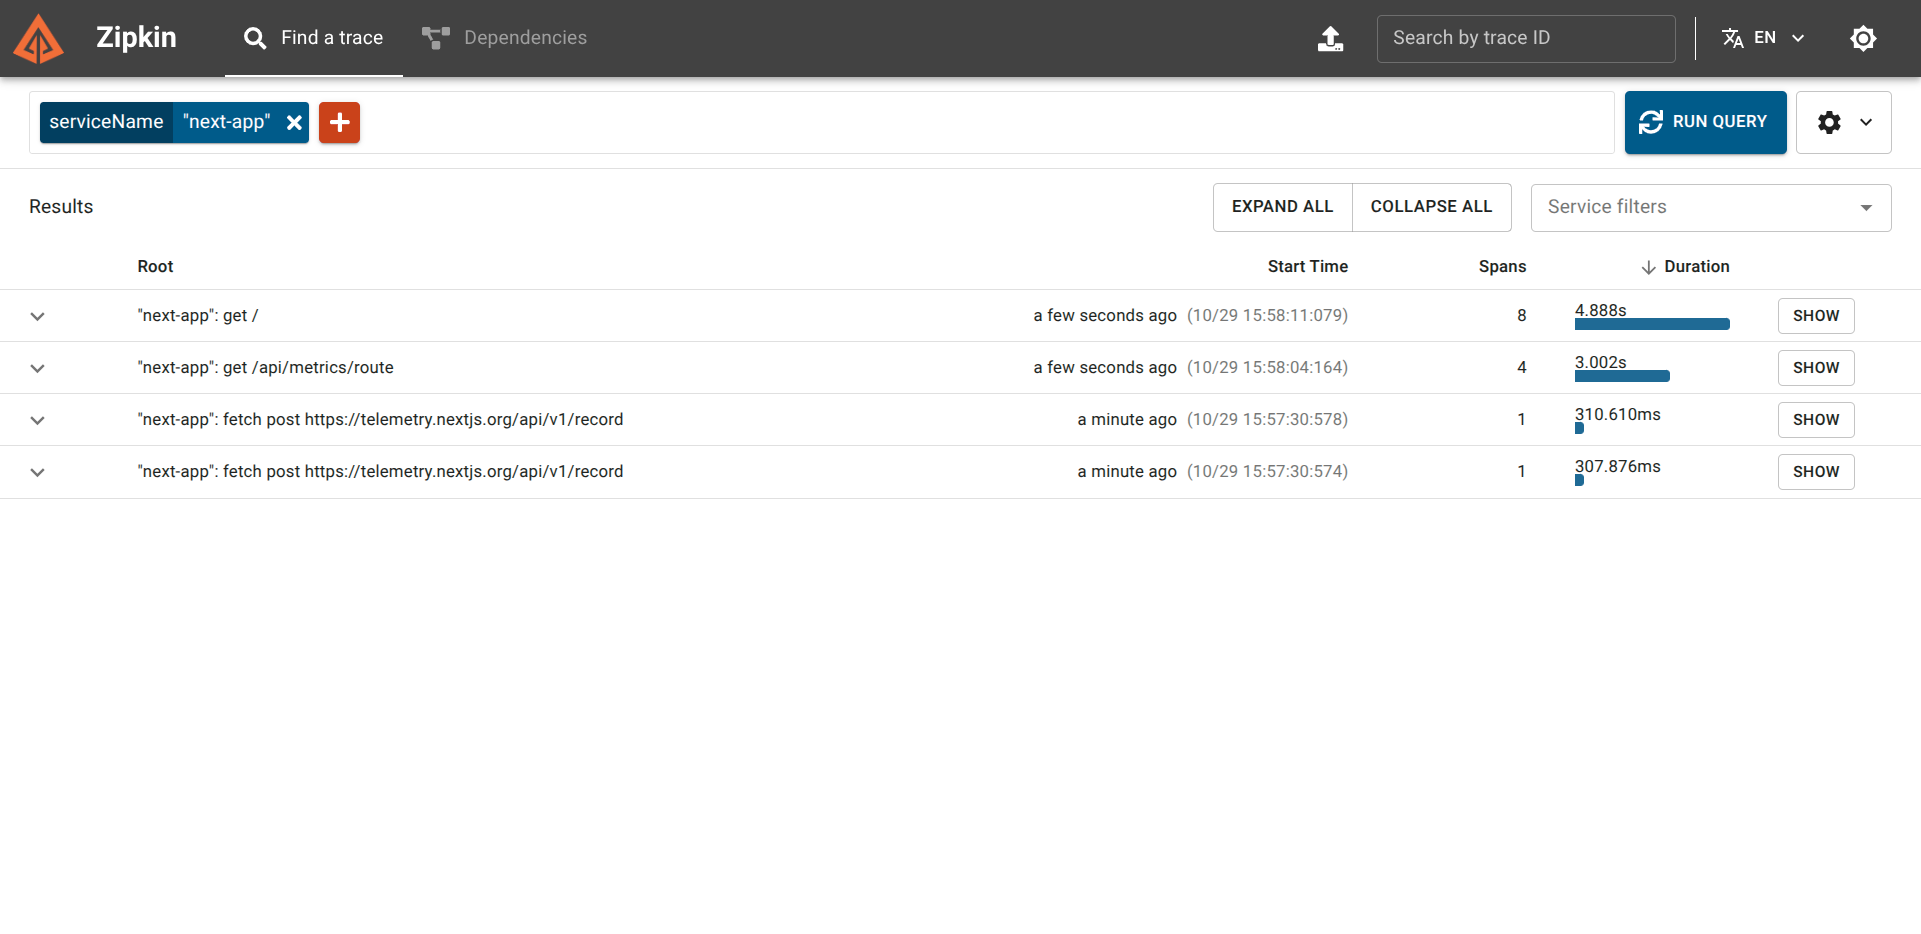
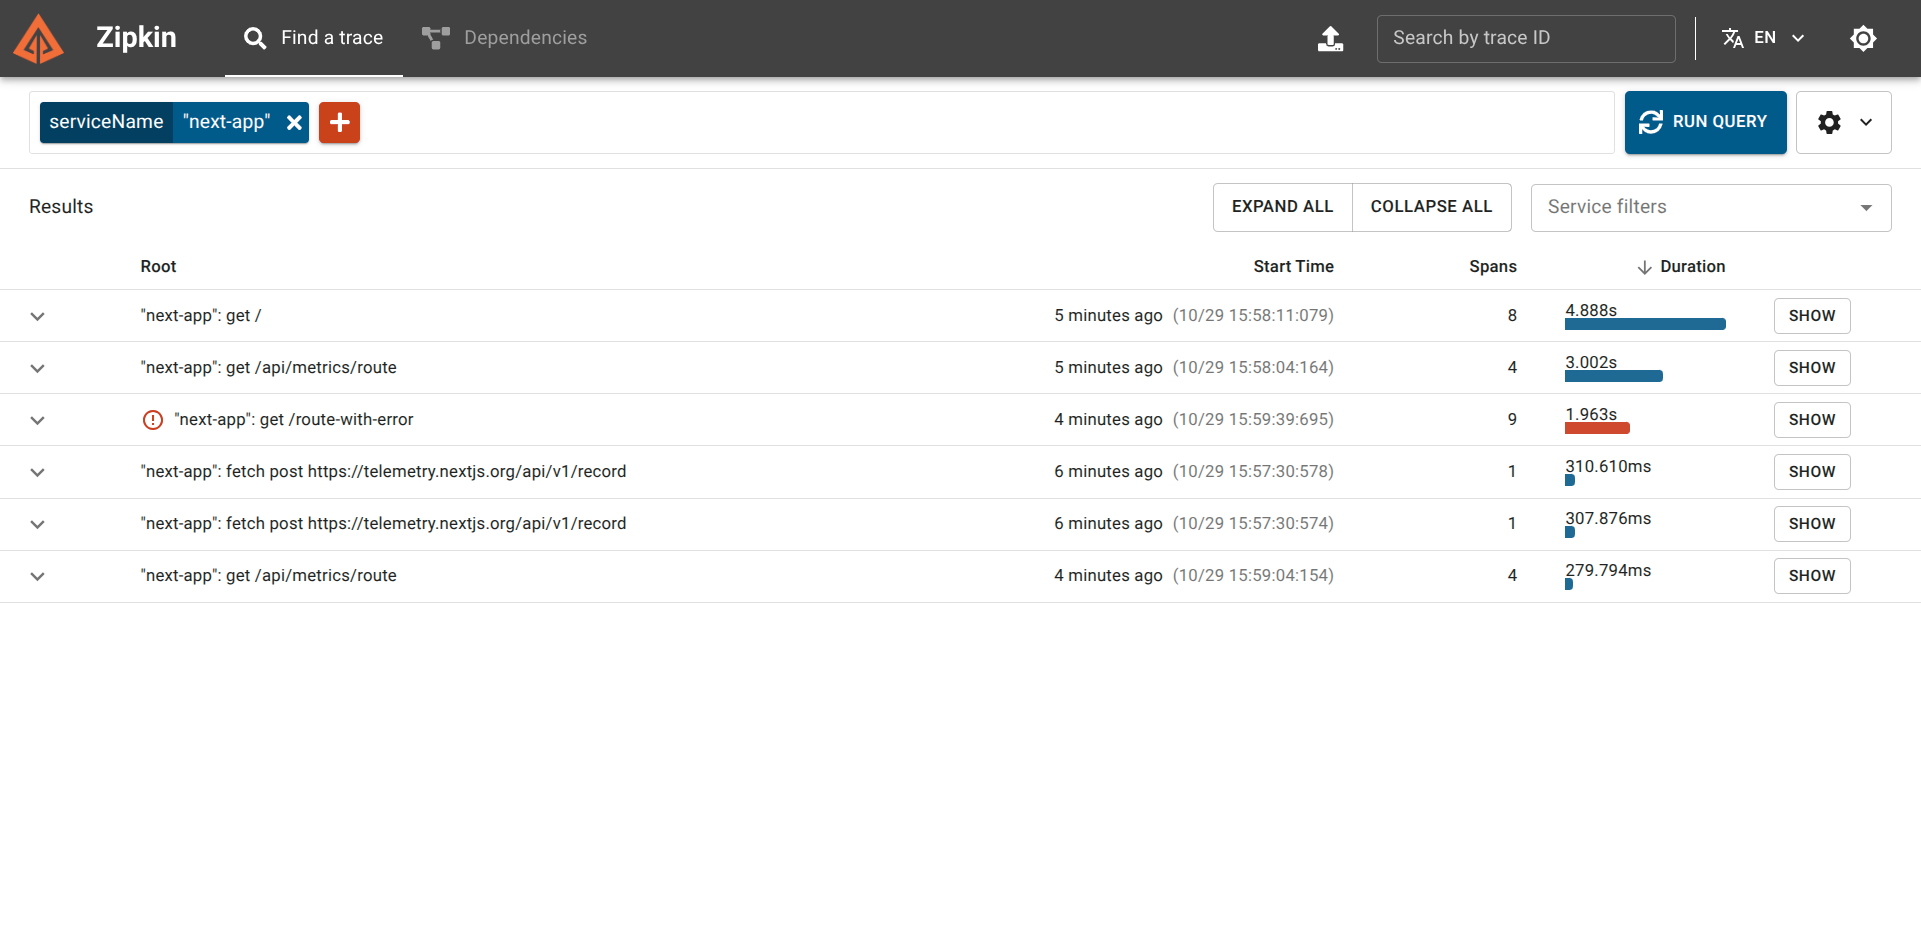
To see the traces:
- Go to the Zipkin UI: http://localhost:9411/zipkin/
- On the top left, click the red “+” button, and select the Service Name
next-app. Then click RUN QUERY.
You will see spans for all the recent requests, including those generated by Prometheus scraping the /api/metrics endpoint.
Troubleshooting the Production Error
Let’s return to our original problem: the blank production screen. We’ll recreate the scenario with a component that intentionally breaks.
Create a simple route /route-with-error with broken logic:
export const dynamic = "force-dynamic";

async function getData() {
    const res = await fetch("https://httpbin.org/status/500");
    return res.json();
}

export default async function RouteWithError() {
    const data = await getData();

    return (
        <div className="flex flex-col gap-4">
            <p>
                The data is: <strong>{JSON.stringify(data)}</strong>
            </p>
        </div>
    );
}
If you visit http://localhost:3000/route-with-error in a production build, you will get the dreaded blank page with no indication of what happened.
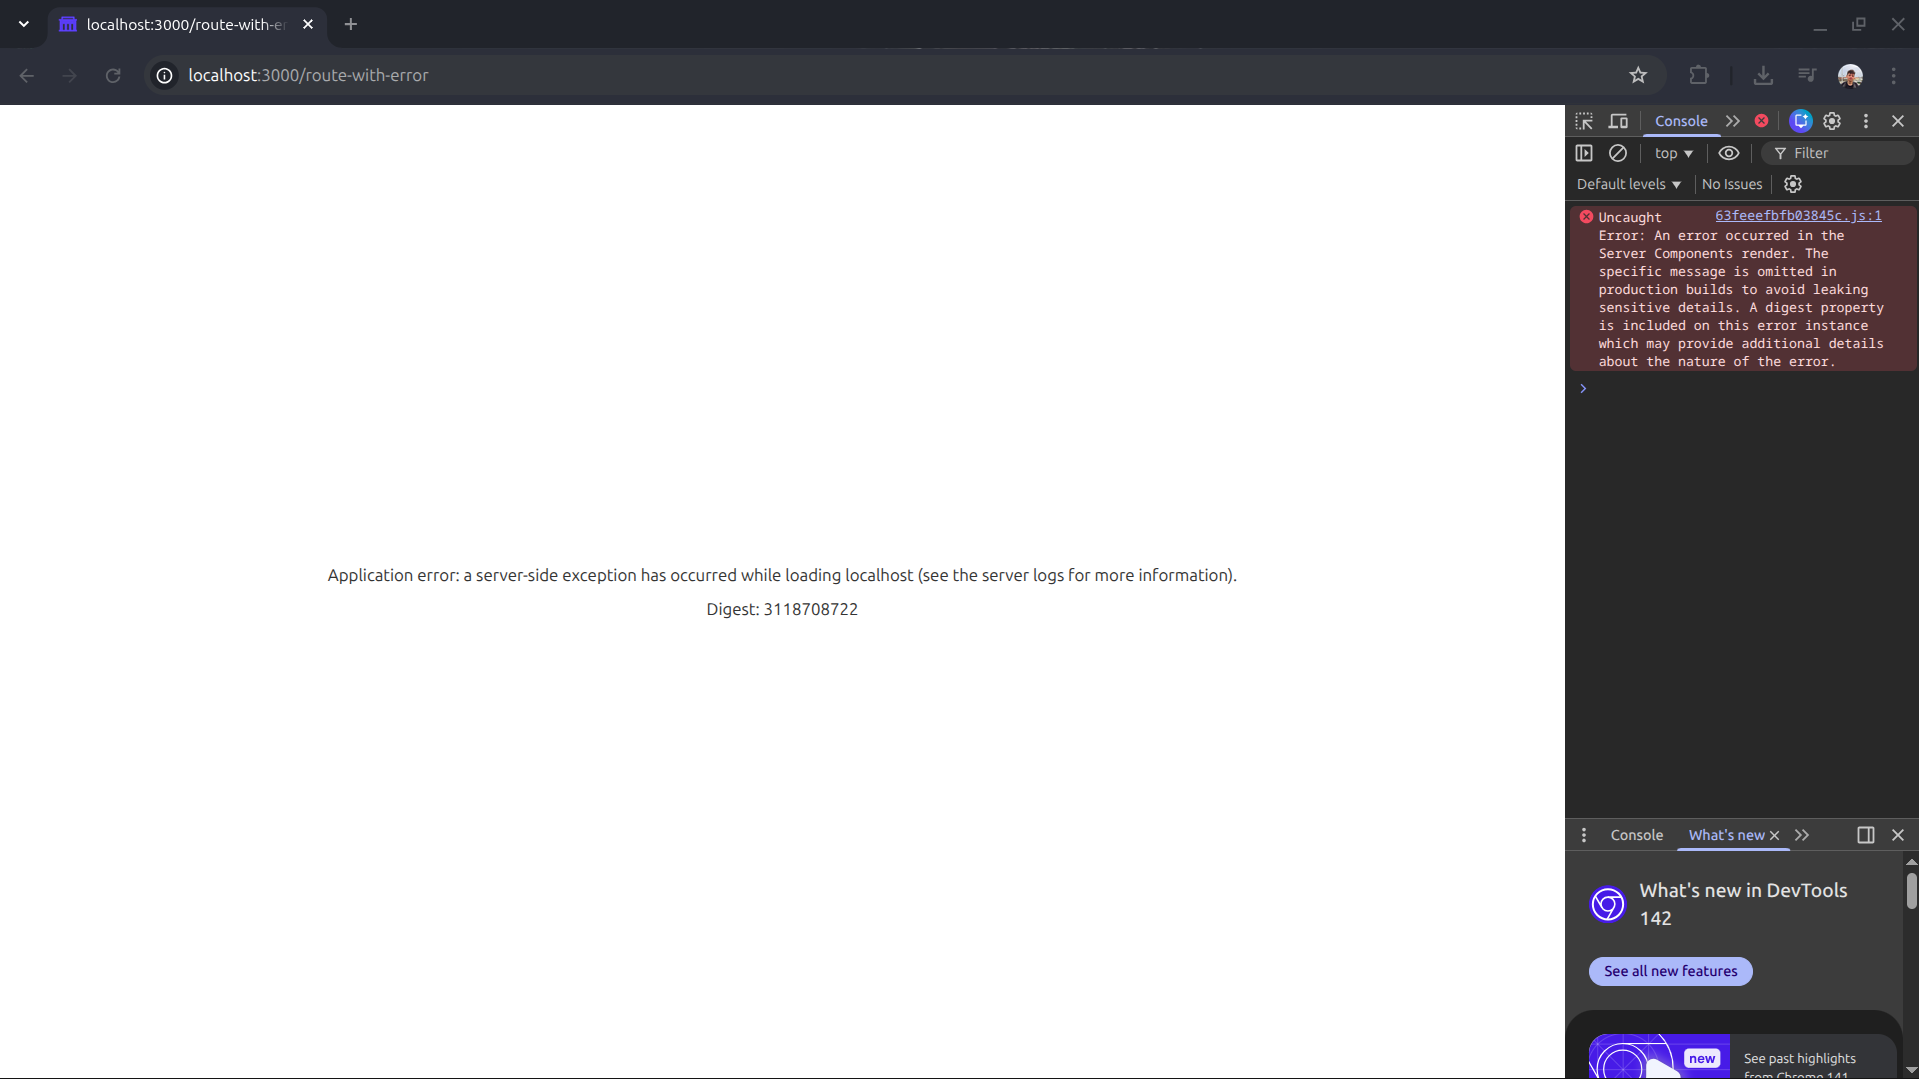
However, when checking Zipkin, the story is completely different:
If we click into the trace, we find the exact details:
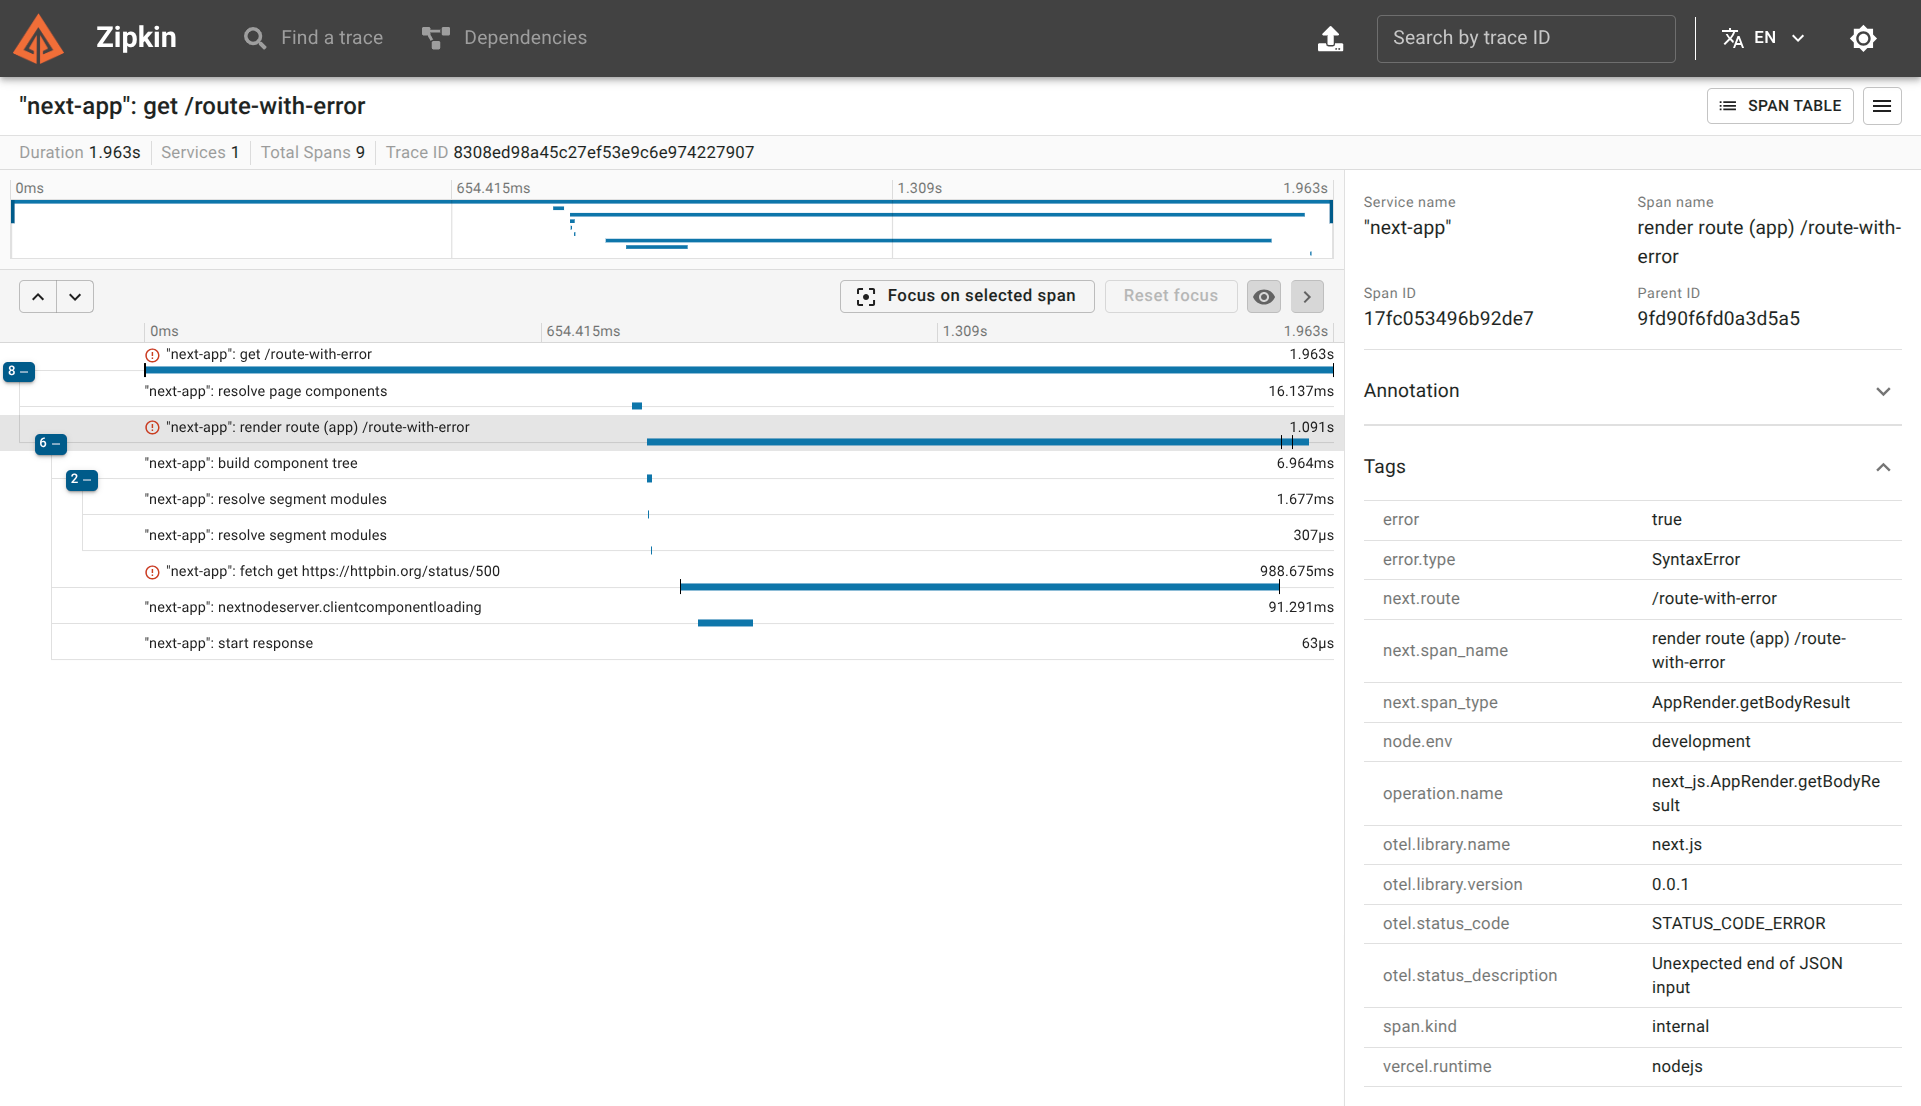
From this single trace, we know the exact route, the exact type of error (Unexpected end of JSON input), and the exact cause (fetch get https://httpbin.org/status/500). We can immediately jump to the corresponding code and fix the bug.
What’s Next?
We have established a robust, local monitoring stack using industry-standard tools. The obvious next step is deploying this same monitoring strategy to our production VPS environment, tackling the challenges of external hostnames, persistent storage, and authentication.