
Large Software Projects: Collecting Metrics
Posted on October 26, 2025 • 6 minutes • 1106 words • Other languages: Español
This post is part of my Large Software Projects blog series .
- Code Source
- Blog Focus: The Metrics
- Prom-client
- The Runtime Split: A Next.js Requirement
- Next.js Instrumentation: Initializing Prom-client
- Prometheus
- Grafana Dashboard Setup
- What’s Next?
Code Source
All code snippets shown in this post are available in the dedicated branch for this article on the project’s GitHub repository. Feel free to clone it and follow along:
https://github.com/franBec/tas/tree/feature/2025-10-26
Blog Focus: The Metrics
In the previous part, we established our hybrid monitoring architecture. Now it’s time to build the first pillar: Metrics.
We will focus on implementing the entire pipeline for numerical data, from collection to visualization:
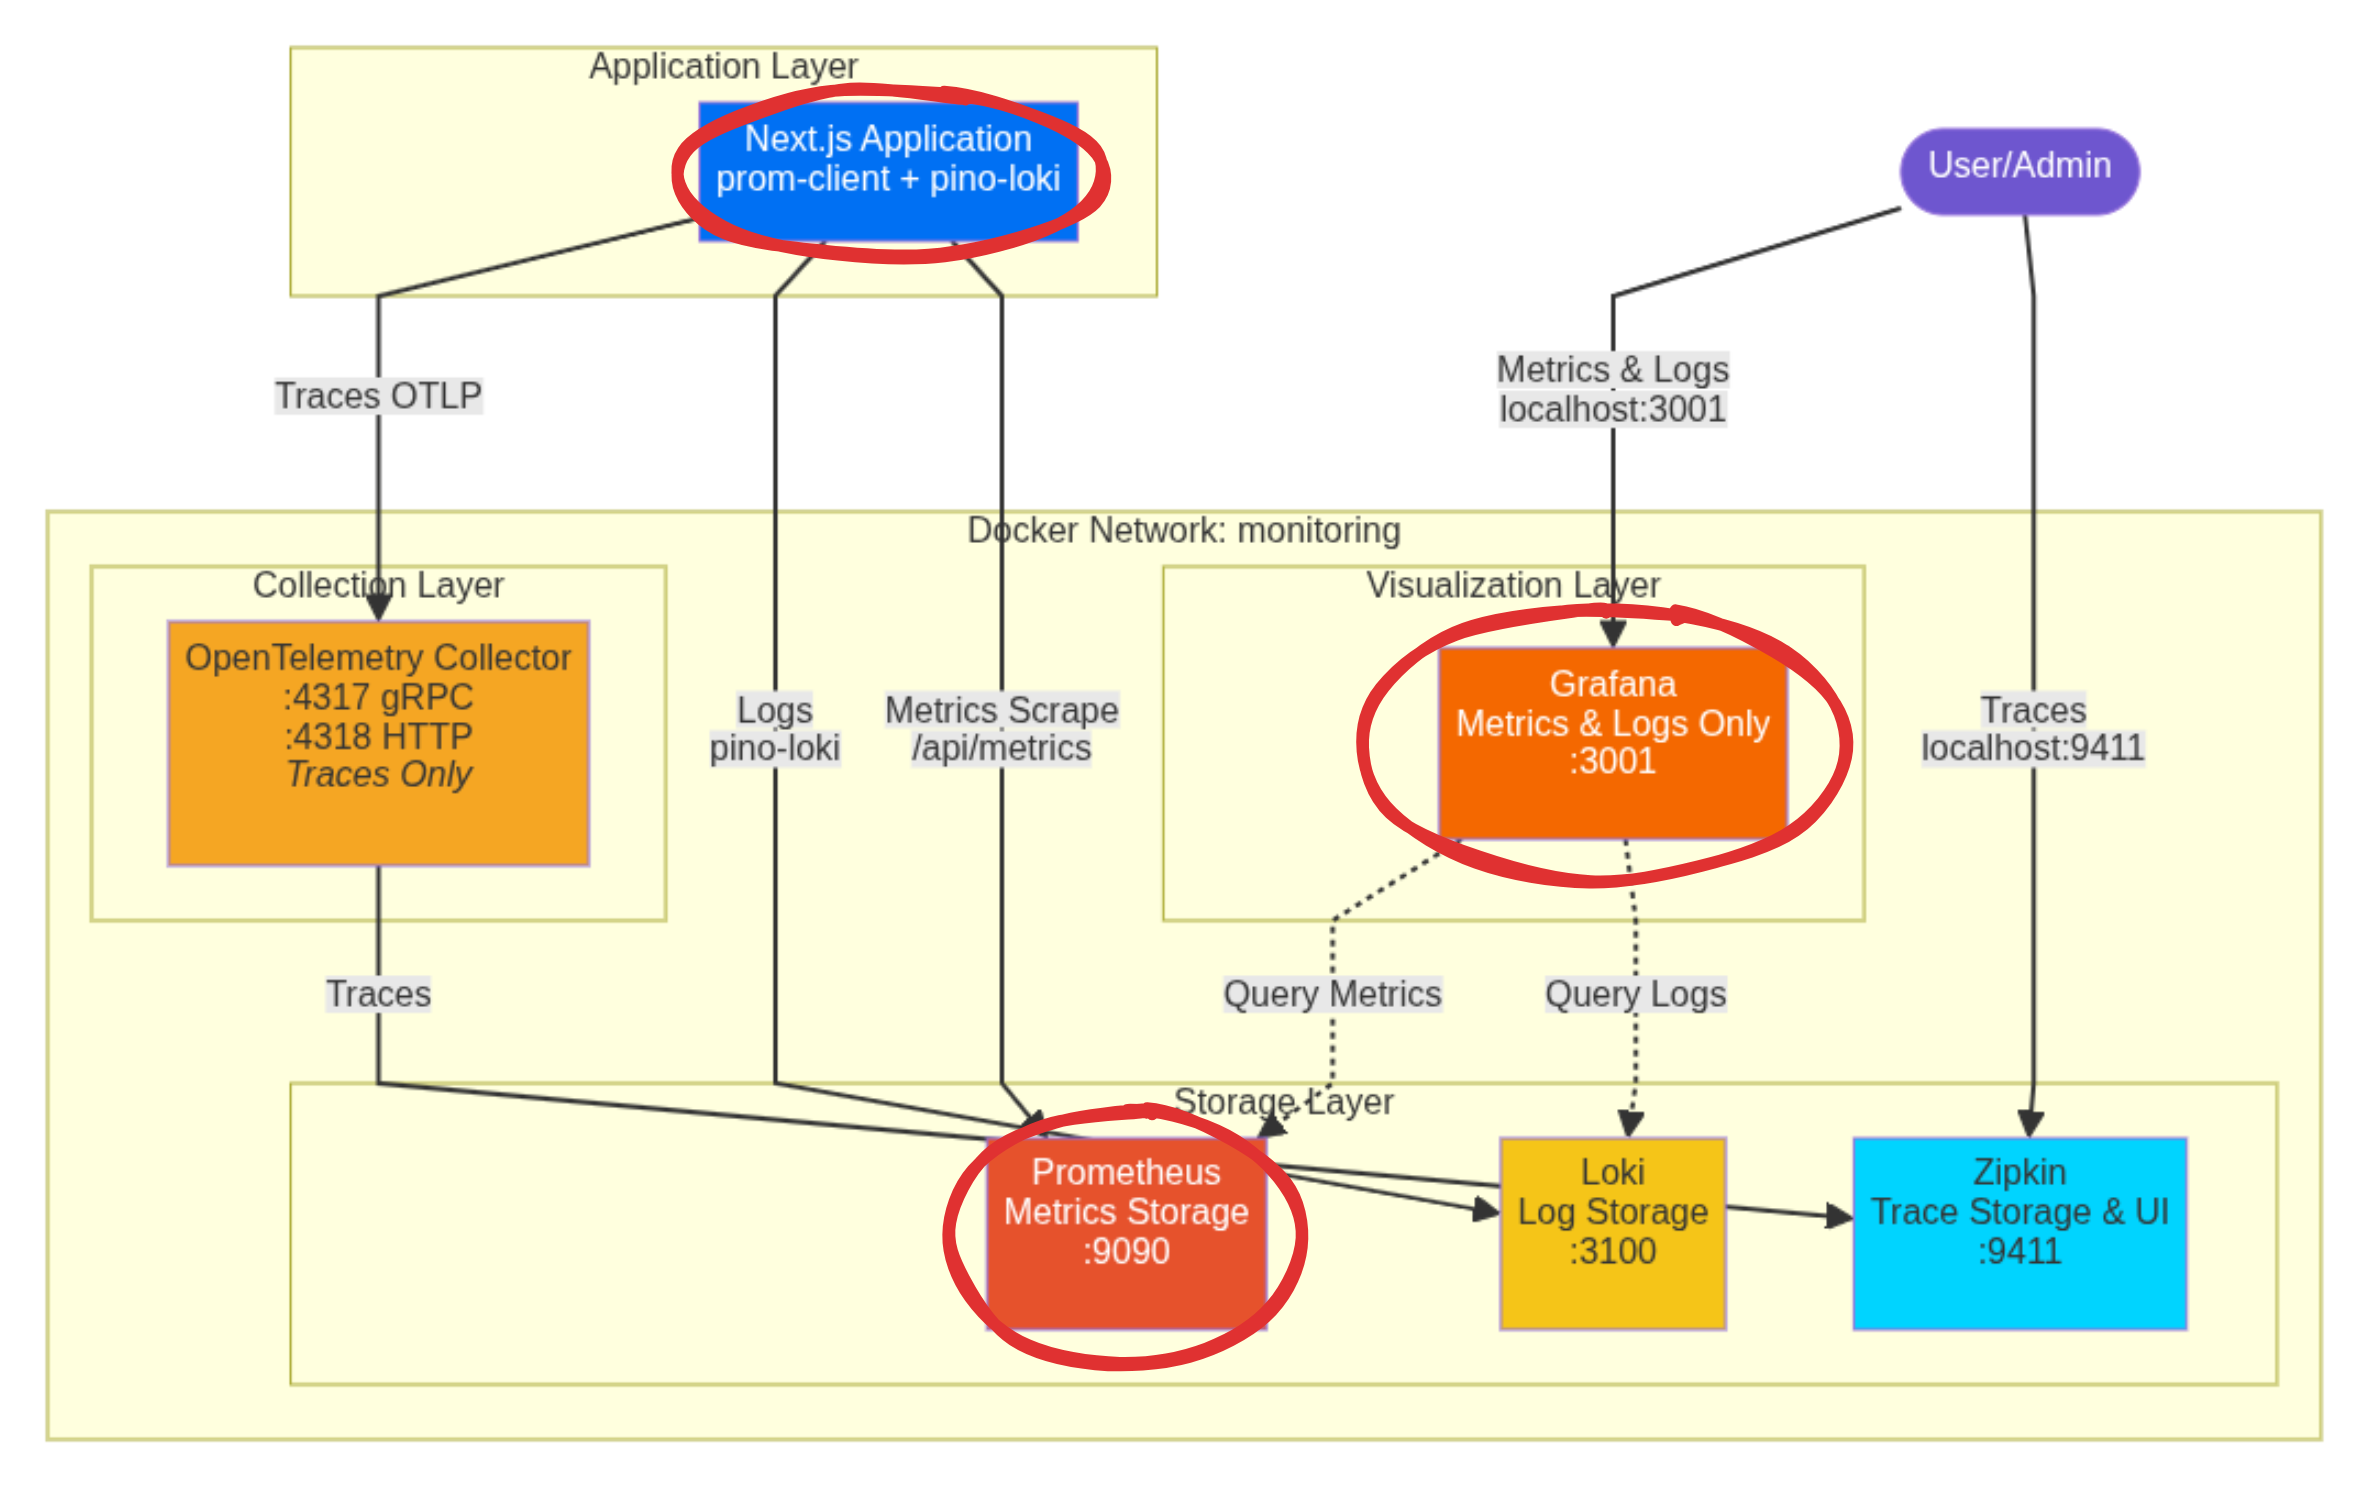
This involves:
- The
prom-clientintegration within the Next.js Application. - The Prometheus scraper/backend.
- The Grafana visualization layer for metrics.
Let’s get our hands dirty.
Prom-client
Prom-client is the established, performant library for generating metrics in the Prometheus format. By calling one simple function, we gain automatic insight into CPU, memory, garbage collection, data that is often complex to gather via pure OpenTelemetry methods.
To install it run pnpm add prom-client.
The Runtime Split: A Next.js Requirement
A critical consideration in Next.js is that parts of your application might run in different environments.
- Node.js Runtime: The traditional, full-featured server environment. This is where system-level monitoring tools like
prom-clientmust run. - Edge Runtime: A lightweight environment optimized for network speed. It does not support full Node.js APIs.
We must explicitly check for the nodejs runtime environment to prevent runtime crashes when importing and initializing our monitoring tools.
Next.js Instrumentation: Initializing Prom-client
Next.js uses the special src/instrumentation.ts file to run initialization code once when a new server instance starts. This is the perfect place to register our metrics system.
We will initialize the metrics registry and make it globally available using globalThis.metrics.
// Based of https://github.com/adityasinghcodes/nextjs-monitoring/blob/main/instrumentation.ts
// Node.js-specific imports are moved into dynamic imports within runtime checks
// Prevent Edge runtime from trying to import Node.js-specific modules
declare global {
    var metrics:
        | {
        registry: any;
    }
        | undefined;
}

export async function register() {
    if (process.env.NEXT_RUNTIME === "nodejs") {
        const { Registry, collectDefaultMetrics } = await import("prom-client");

        // Prom-client initialization
        const prometheusRegistry = new Registry();
        collectDefaultMetrics({
            register: prometheusRegistry,
        });
        globalThis.metrics = {
            registry: prometheusRegistry,
        };
    }
}
Infrastructure Developer Notes
- Global Scope: We use
globalThisto share theprometheusRegistryacross modules, asinstrumentation.tsruns outside the standard module execution. - Linting Exception: Due to the necessary
globalThisvariable declarations, this file will clash with the linting rules. Addsrc/instrumentation.tsto theeslint.config.mjsignores list. - Testing Exception: As an infrastructure file, this is not suitable for unit testing. Add
src/instrumentation.tsto thevitest.config.mtstest coverage exclude list.
Prometheus
Prometheus is a pull-based system: it doesn’t wait for your application to send data; it periodically scrapes (pulls) data from a dedicated HTTP endpoint you expose.
1. Expose the Metrics Endpoint
We create a simple api/metrics API route that uses our globally defined registry to output the gathered metrics data in the raw text format Prometheus expects.
// Based of https://github.com/adityasinghcodes/nextjs-monitoring/blob/main/app/api/metrics/route.ts
import { NextResponse } from "next/server";

export const runtime = "nodejs";

export async function GET() {
    try {
        if (!globalThis?.metrics?.registry) {
            return new NextResponse("Metrics Unavailable", {
                status: 503,
                headers: {
                    "Content-Type": "text/plain",
                },
            });
        }

        const metrics = await globalThis.metrics.registry.metrics();
        return new NextResponse(metrics, {
            headers: {
                "Content-Type": "text/plain",
            },
        });
    } catch (error) {
        console.error("Error collecting metrics:", error);
        return new NextResponse("Error collecting metrics", {
            status: 500,
            headers: {
                "Content-Type": "text/plain",
            },
        });
    }
}
2. Configure Prometheus to Scrape the Endpoint
In src/resources/dev/monitoring/prometheus.yml, we define a scraping job that tells the Prometheus container where to find the application endpoint.
# Based of https://github.com/adityasinghcodes/nextjs-monitoring/blob/main/prometheus.yml
# Configuration for scraping metrics from different targets
scrape_configs:
  # Job for collecting metrics from Next.js application
  - job_name: "next-app"
    # Static list of target endpoints to scrape
    static_configs:
      # Using host.docker.internal to access host machine from Docker container
      # Port 3000 is the default Next.js port
      - targets: ["host.docker.internal:3000"]
    # Path where metrics endpoint is exposed in the Next.js app
    metrics_path: "/api/metrics"
3. Define Grafana and Prometheus Docker Services
We use Docker Compose to define the Prometheus backend and the Grafana visualization layer.
src/resources/dev/monitoring/docker-compose.yml
# Based of https://github.com/adityasinghcodes/nextjs-monitoring/blob/main/docker-compose.yml
services:
  grafana:
    container_name: grafana
    image: grafana/grafana:11.4.0
    ports:
      - "3001:3000"
    environment:
      - GF_SECURITY_ADMIN_USER=admin_user
      - GF_SECURITY_ADMIN_PASSWORD=admin_password
    volumes:
      - grafana-storage:/var/lib/grafana
    networks:
      - monitoring

  prometheus:
    container_name: prometheus
    image: prom/prometheus:v3.0.1
    ports:
      - "9090:9090"
    volumes:
      - ./prometheus.yml:/etc/prometheus/prometheus.yml
      - prometheus-storage:/prometheus
    networks:
      - monitoring

networks:
  monitoring:
    name: monitoring
    driver: bridge

volumes:
  grafana-storage:
  prometheus-storage:
Grafana Dashboard Setup
Make sure your Docker engine (like Docker Desktop ) is running in the background.
- Start the Stack:
docker-compose -f src/resources/dev/monitoring/docker-compose.yml up -d - Start the App: Run your Next.js application’s start script on the host machine.
Go to http://localhost:3001/
and log in using the credentials defined in the docker-compose.yml (admin_user/admin_password).
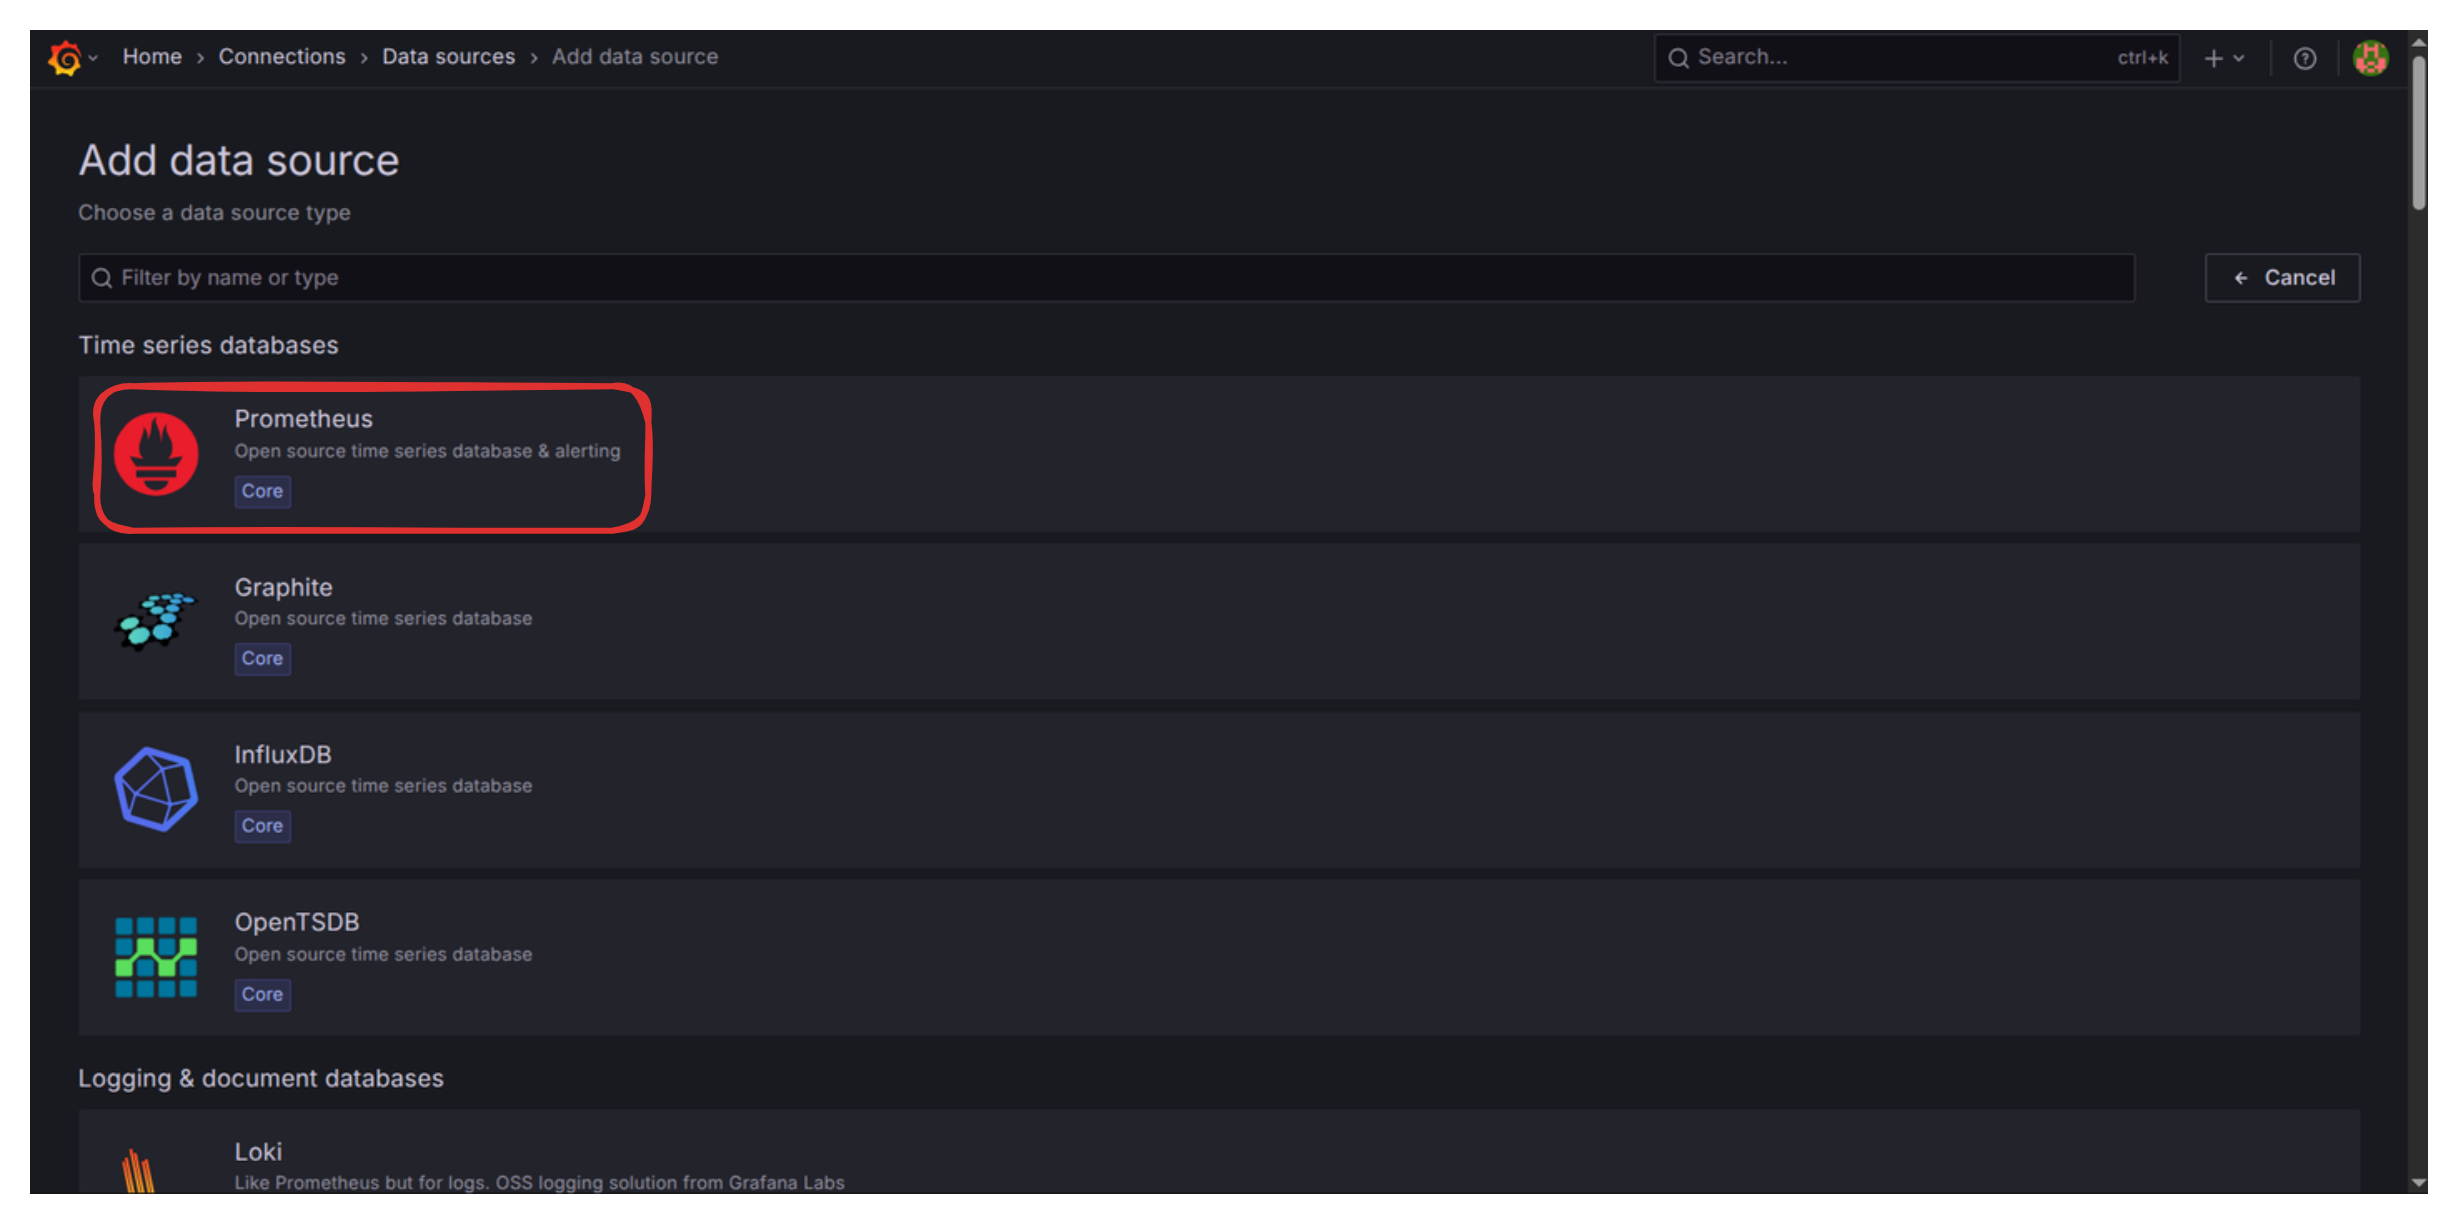
Add Prometheus Data Source
- Navigate to http://localhost:3001/connections/datasources/new
and select Prometheus.
- Set the “Prometheus server URL” to
http://prometheus:9090(We use the Docker service name,prometheus).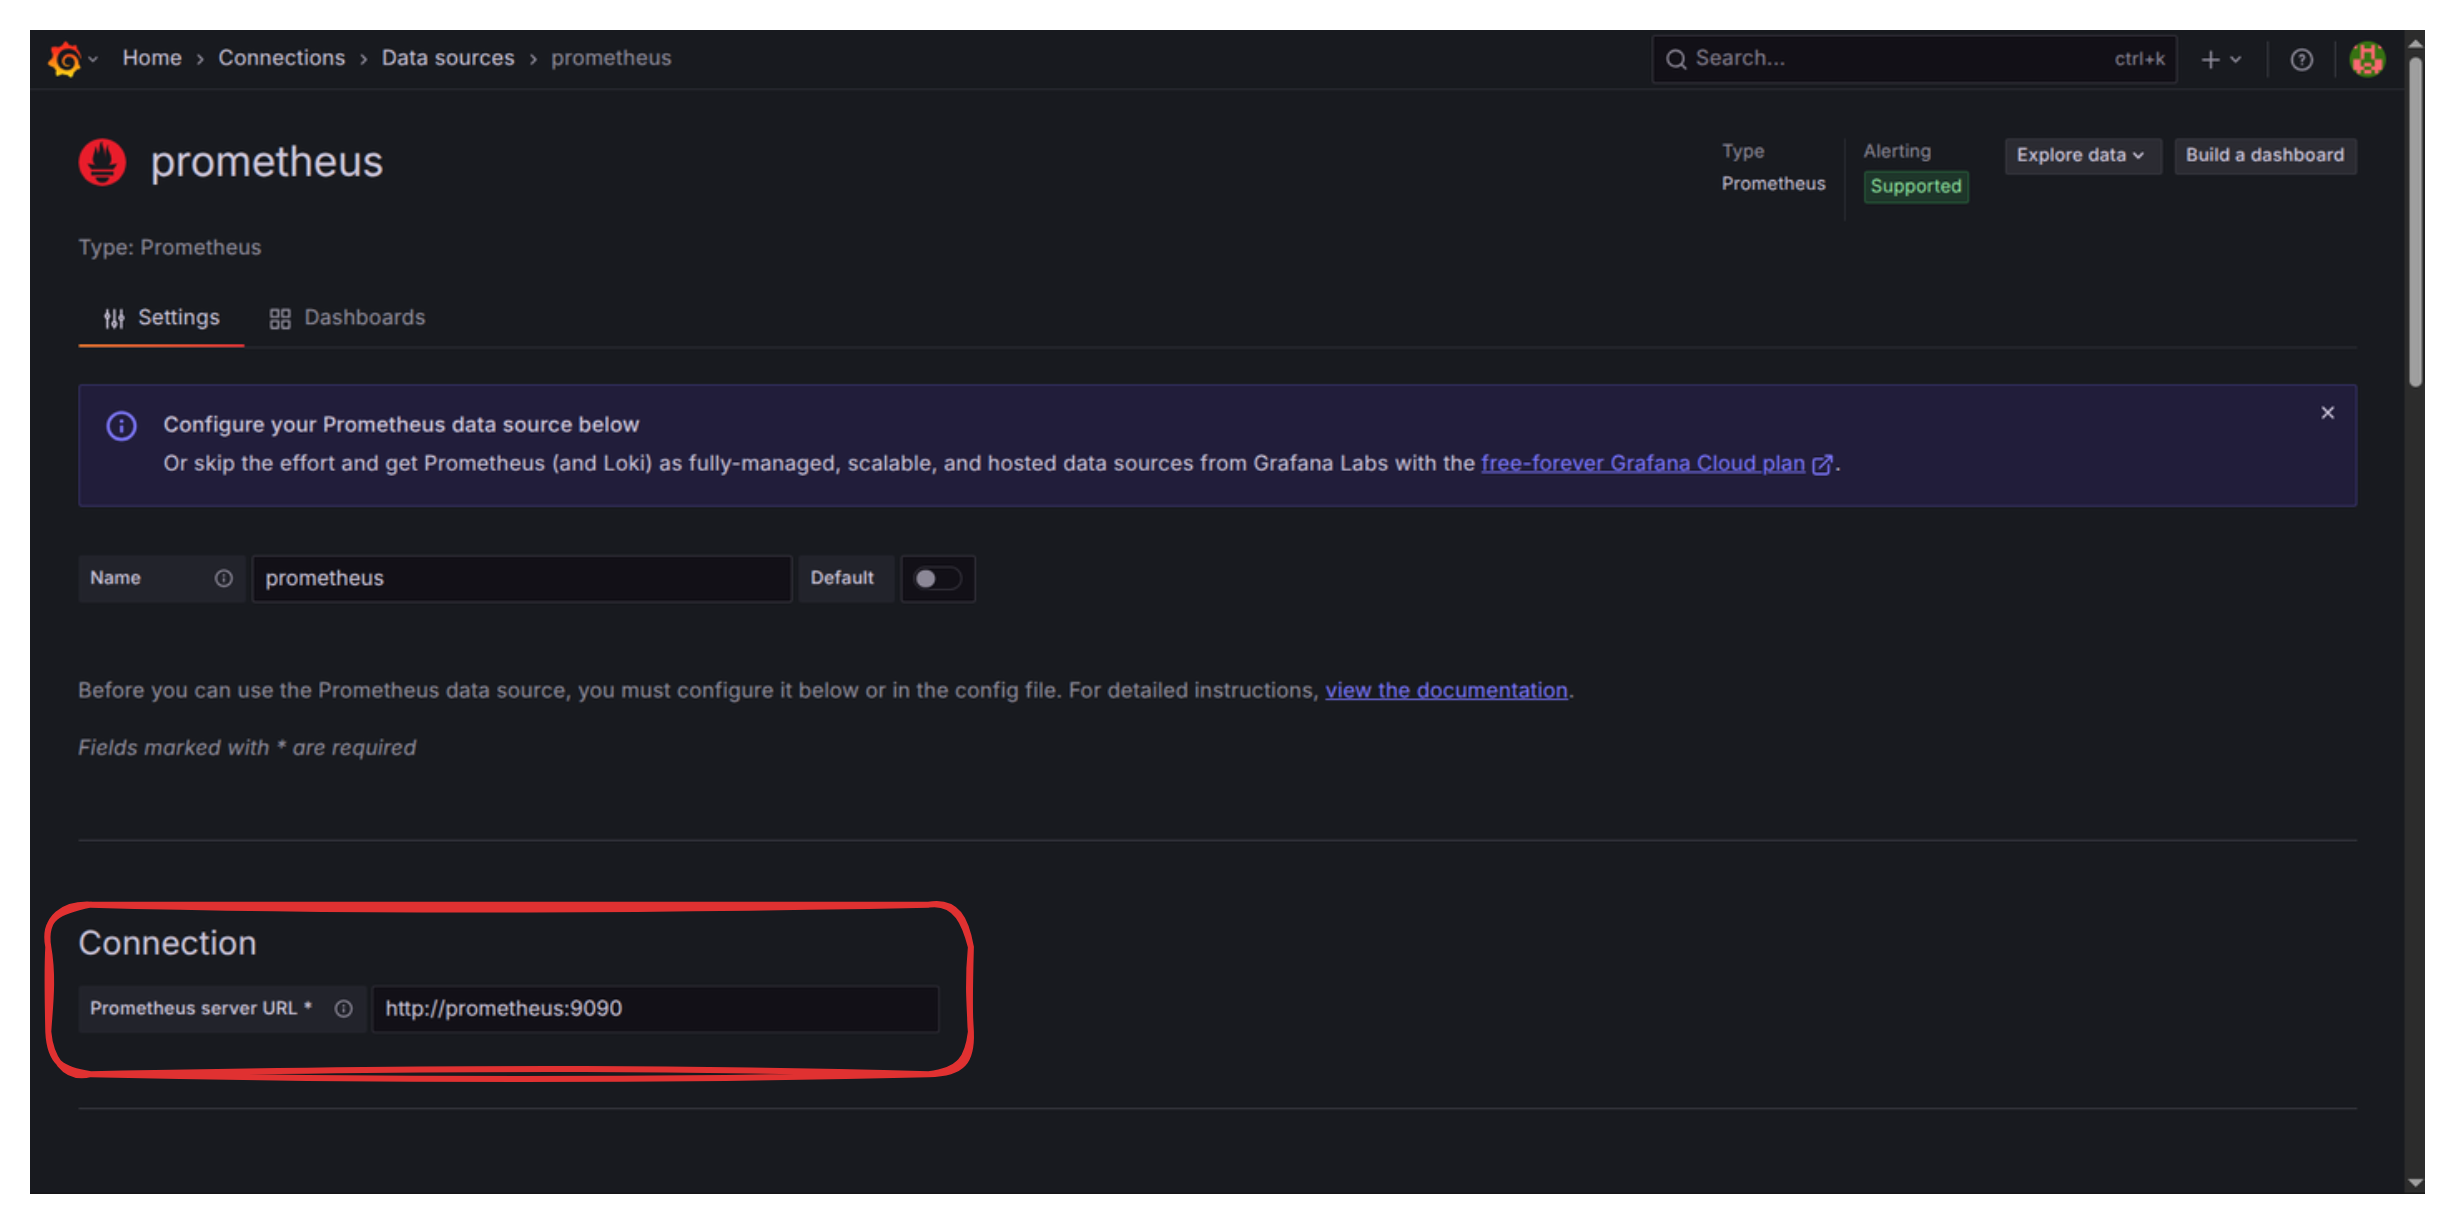
- Scroll down and click “Save & Test.” You should see the confirmation: “Successfully queried the Prometheus API.”
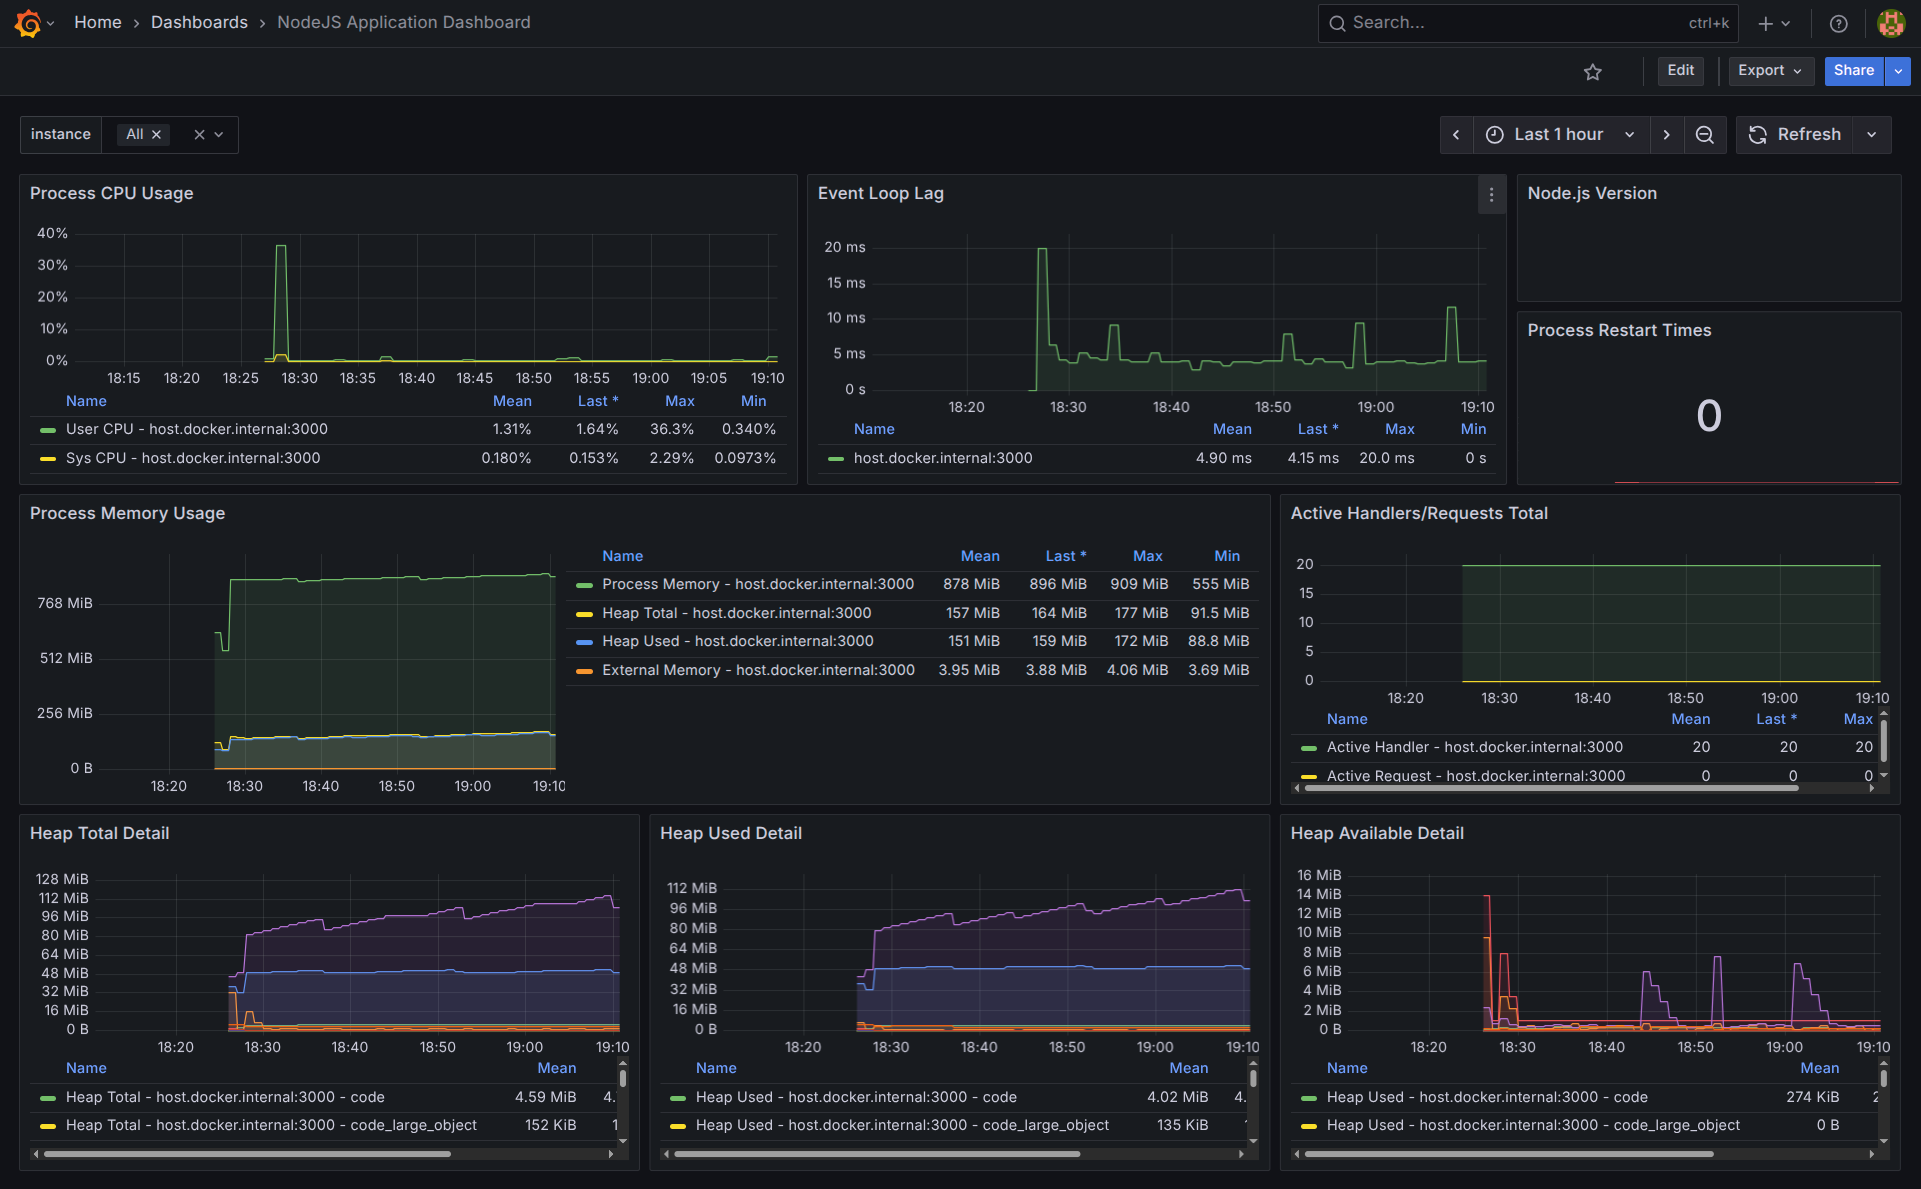
- Import a Dashboard: Go to http://localhost:3001/dashboard/import . We are going to use the community Node.js Application Dashboard (ID 11159).
- Enter Dashboard ID 11159.
- Above the Import button, select the Prometheus data source you just created from the dropdown.
- Click Import.
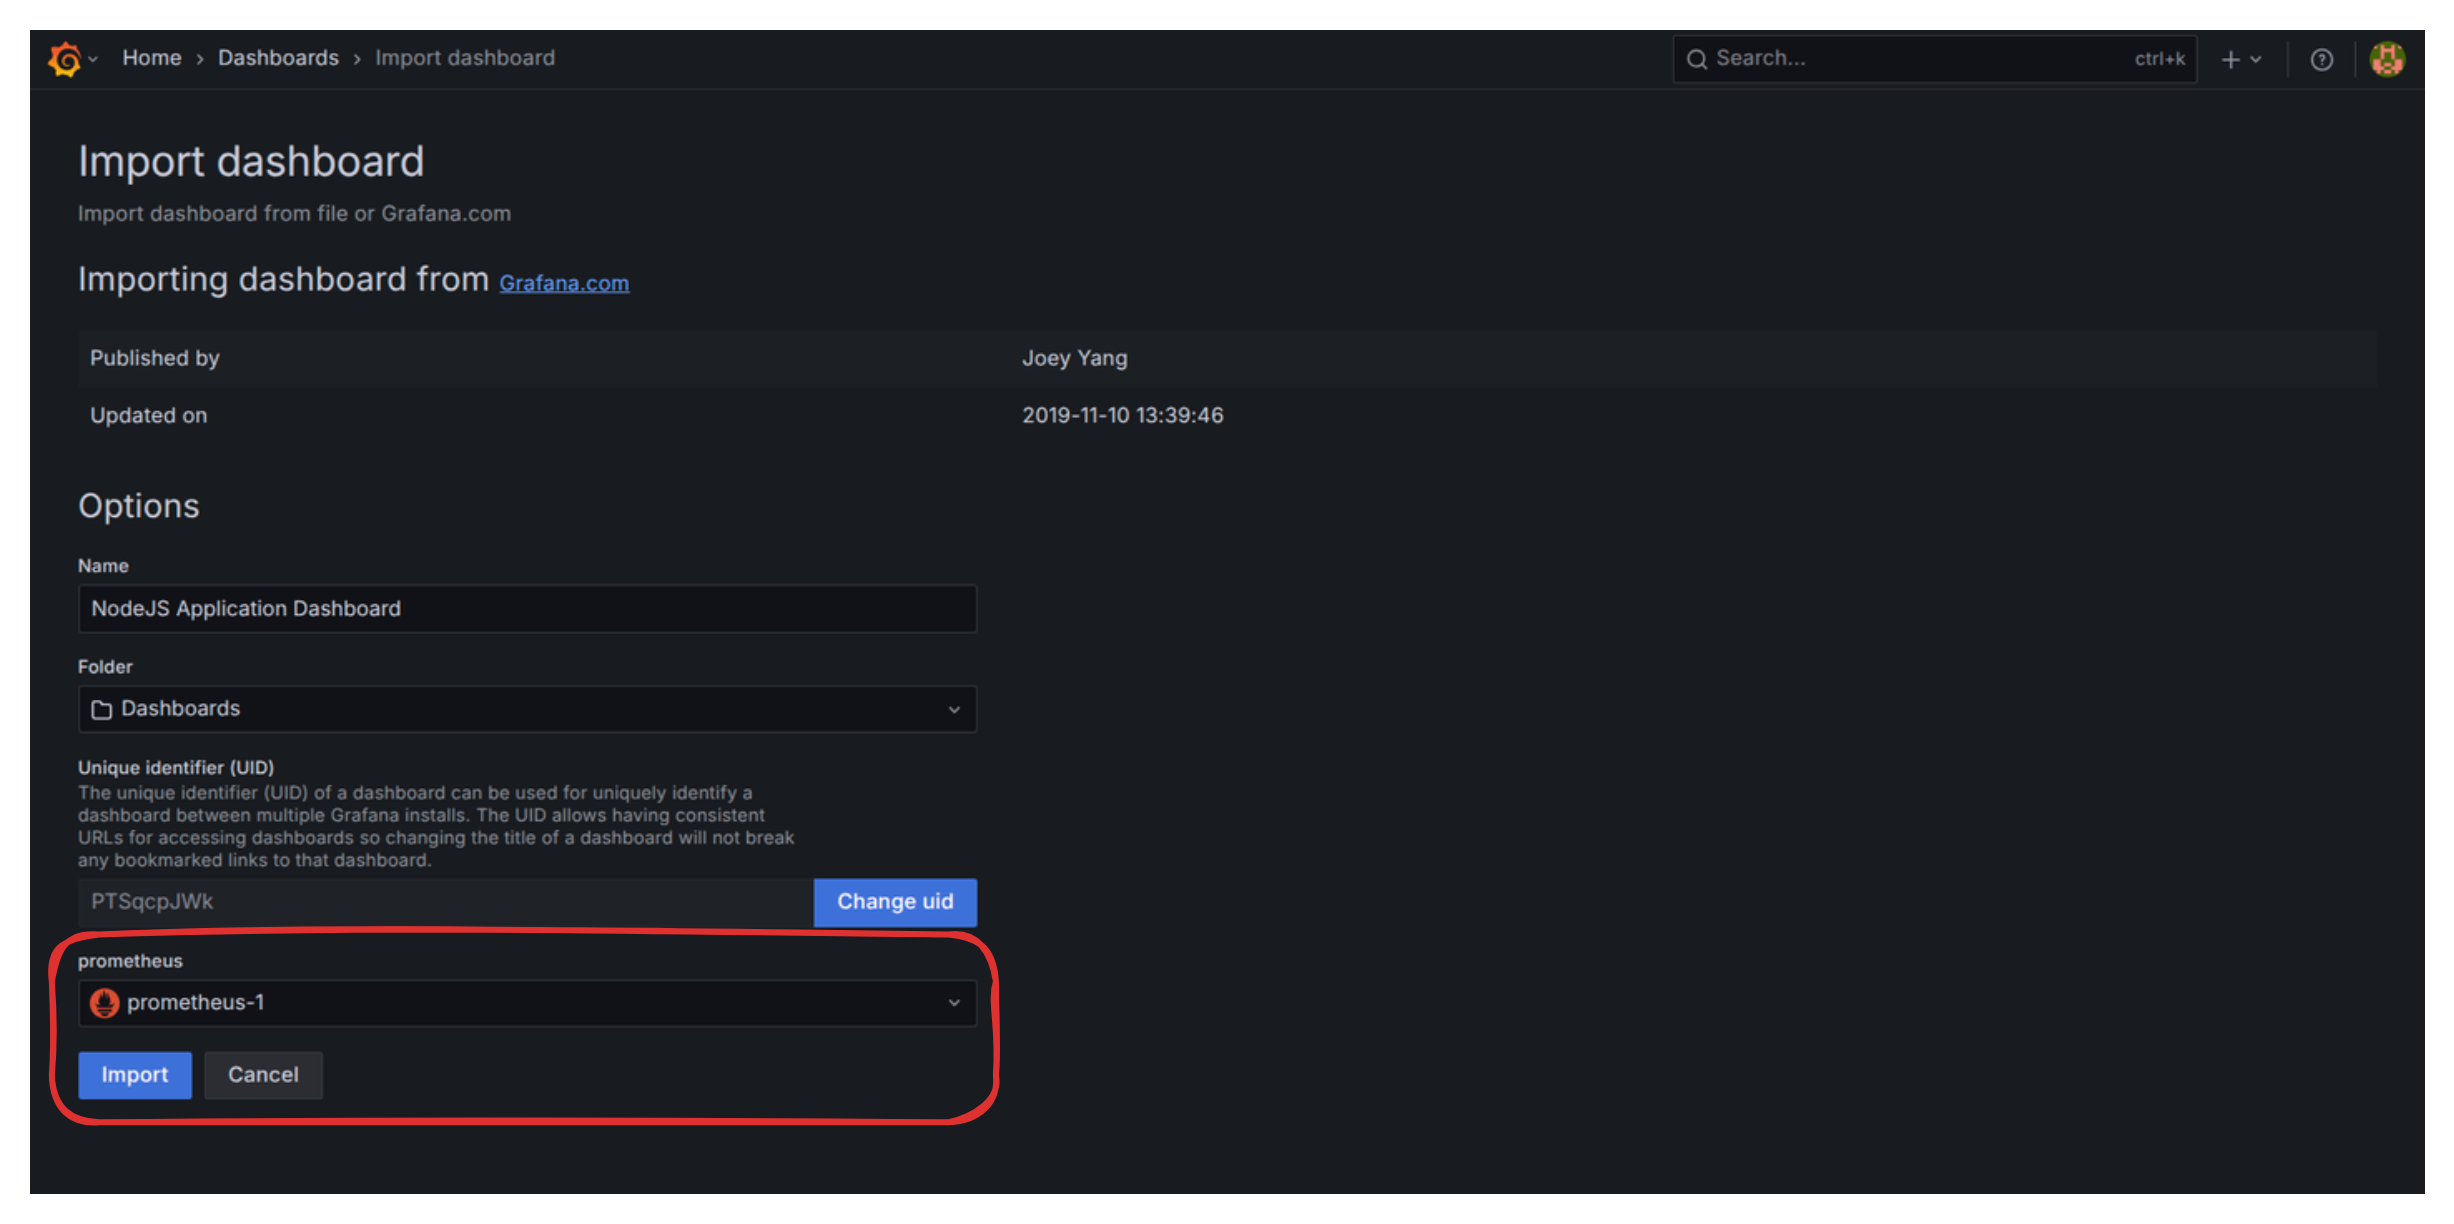
You now have a powerful dashboard displaying automatic metrics like CPU usage, memory consumption, garbage collection activity, and request counts.
Troubleshooting: Fixing the Node.js Version Panel
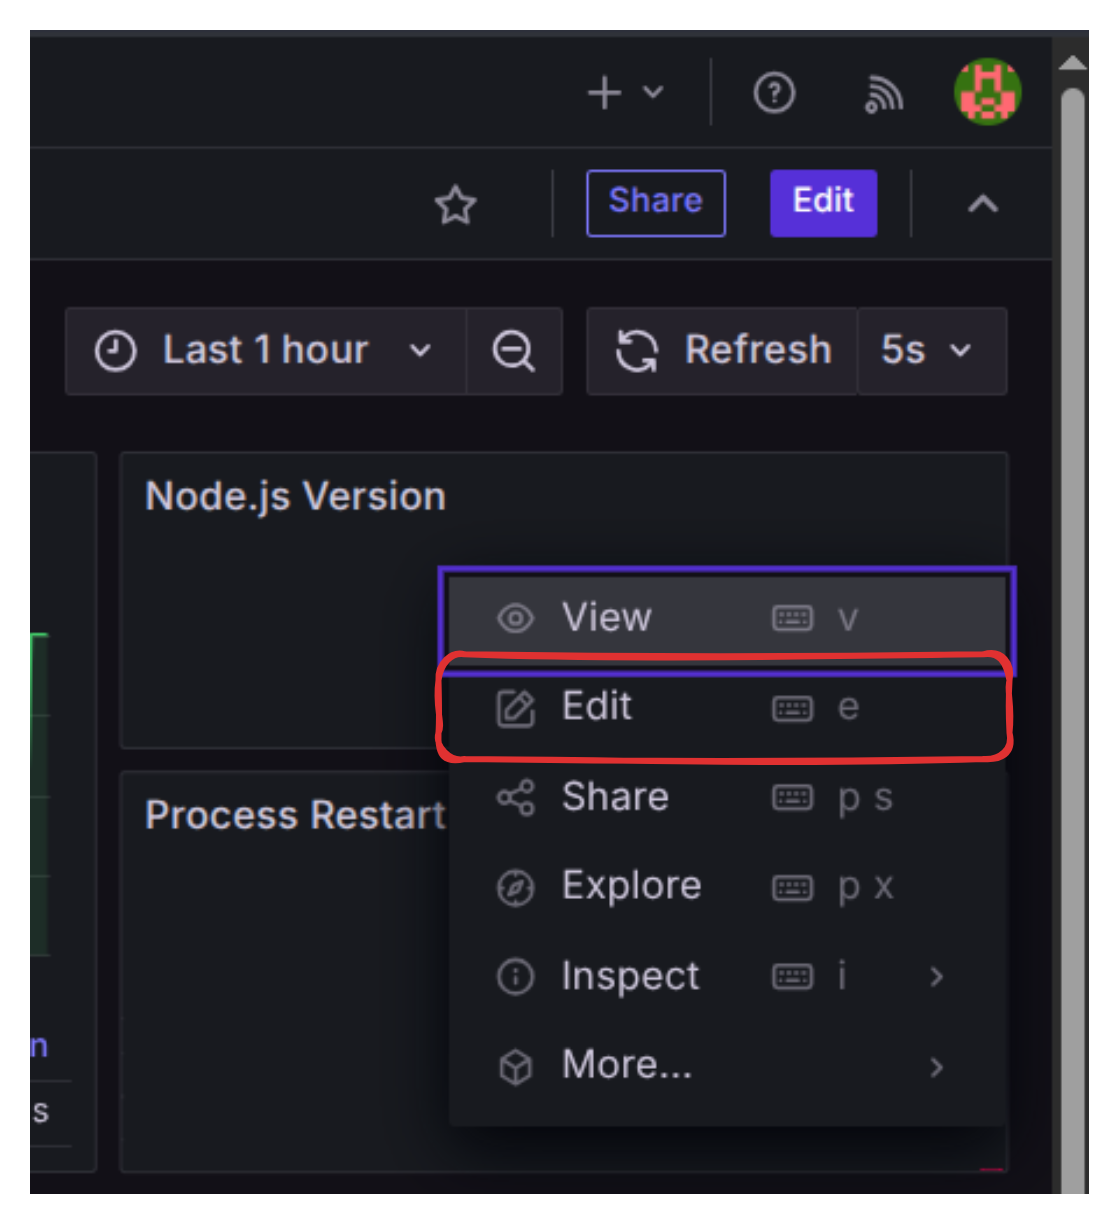
One common issue with this imported dashboard is that the “Node.js version” panel often appears empty. Let’s fix this minor inconvenience:
- Click on the three vertical dots on the top right corner of that empty panel and select Edit.
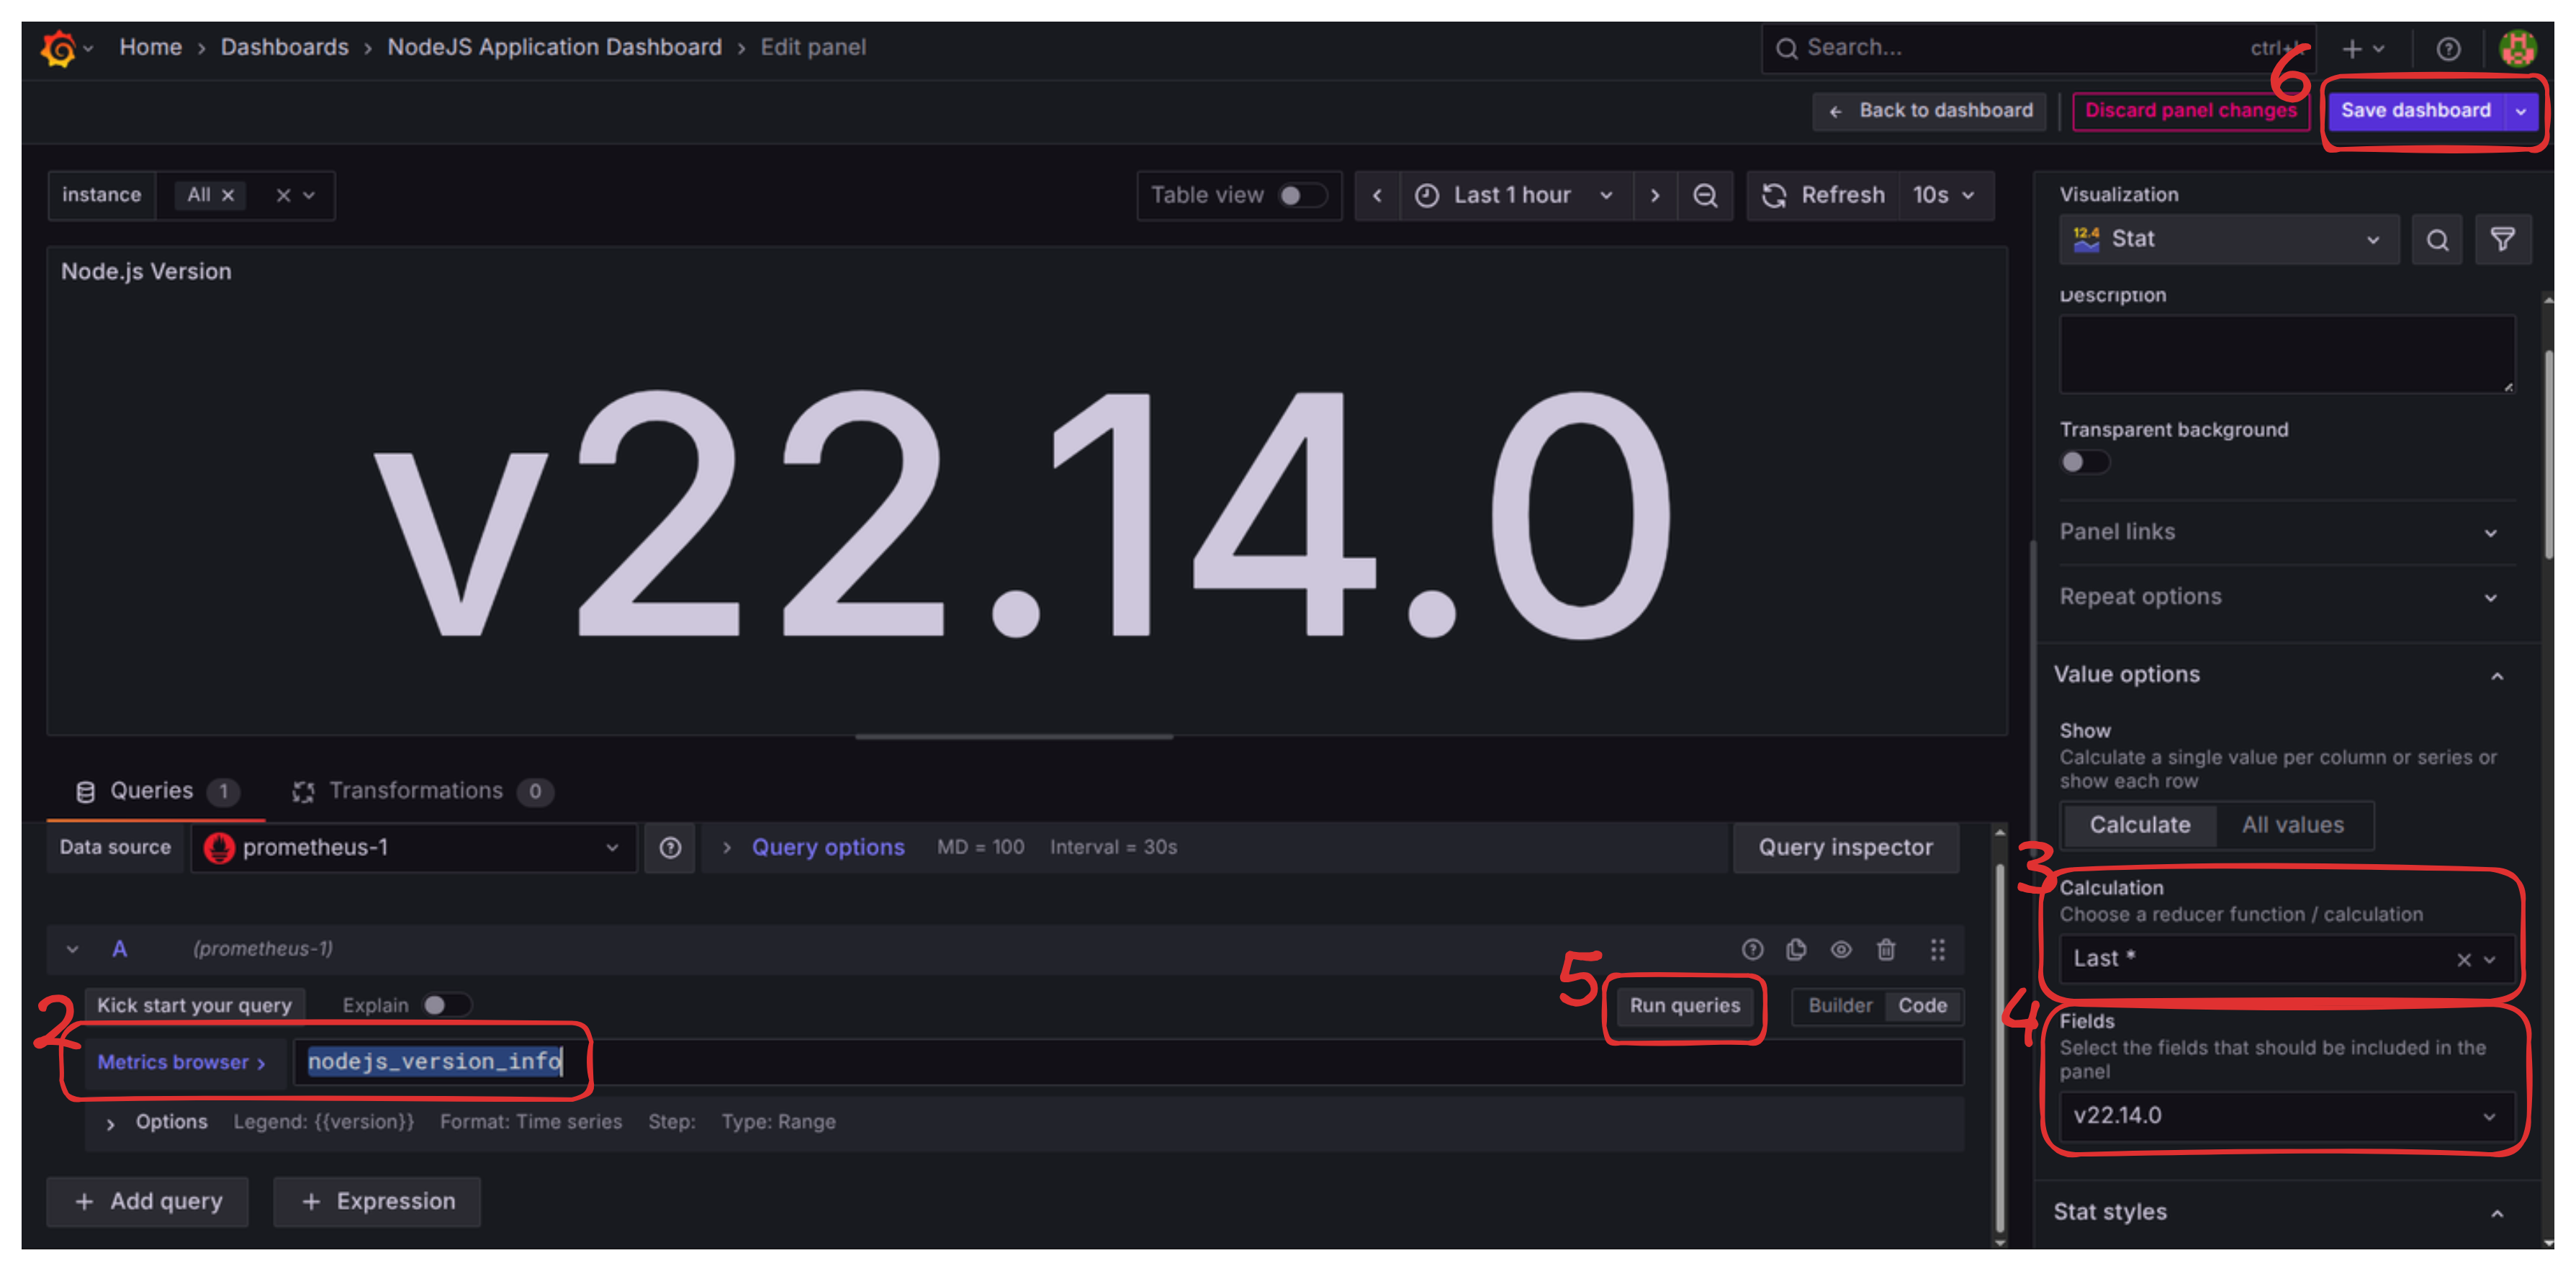
- In the Query editor (“Metric browser” area), clear the default query and input the correct metric name:
nodejs_version_info. - In the right-hand panel, under “Value options” -> “Calculation,” set it to
Last *. - Under “Value options” -> “Fields,” you should now be able to select the version string.
- Click “Run queries” to confirm the data appears.
- Click the “Save Dashboard” button (top right).
What’s Next?
We have successfully implemented the metrics pipeline, giving us deep numerical insight into the health and performance of our application.
However, a dashboard full of graphs only tells us what is happening (e.g., “CPU spiked by 50%”). It doesn’t tell us why (e.g., “The spike was caused by a specific user request hitting a slow database query”).
In the next blog we will set up structured logging with pino-loki.
Next Blog: Large Software Projects: Collecting Logs