
Large Software Projects: Introduction to Monitoring
Posted on October 25, 2025 • 5 minutes • 1006 words • Other languages: Español
This post is part of my Large Software Projects blog series .
- Inspiration and Context
- Why Do We Need Instrumentation?
- How to Manage All These Telemetry Backends?
- The Architectural Trade-Off: OTel Purity vs. Pragmatic Simplicity
- What’s next?
Inspiration and Context
This blog is heavily inspired by Aditya Singh - Codes YouTube video “Debug & Monitor Next.js Apps with Grafana Loki, Prometheus, Zipkin,” which provides an excellent modern blueprint for monitoring a Next.js application.
Also, the thumbnail is inspired by DECO*27 YouTube video “モニタリング” (Monitaringu, Monitoring, quite fitting for today topic).
With those credits out of the way, let’s stop guessing what our code is doing and start knowing for sure.
Why Do We Need Instrumentation?
Imagine you connect to your daily meeting on a Monday, and you are told that a critical route in production is broken. All the reporter has is this terrifying screenshot:
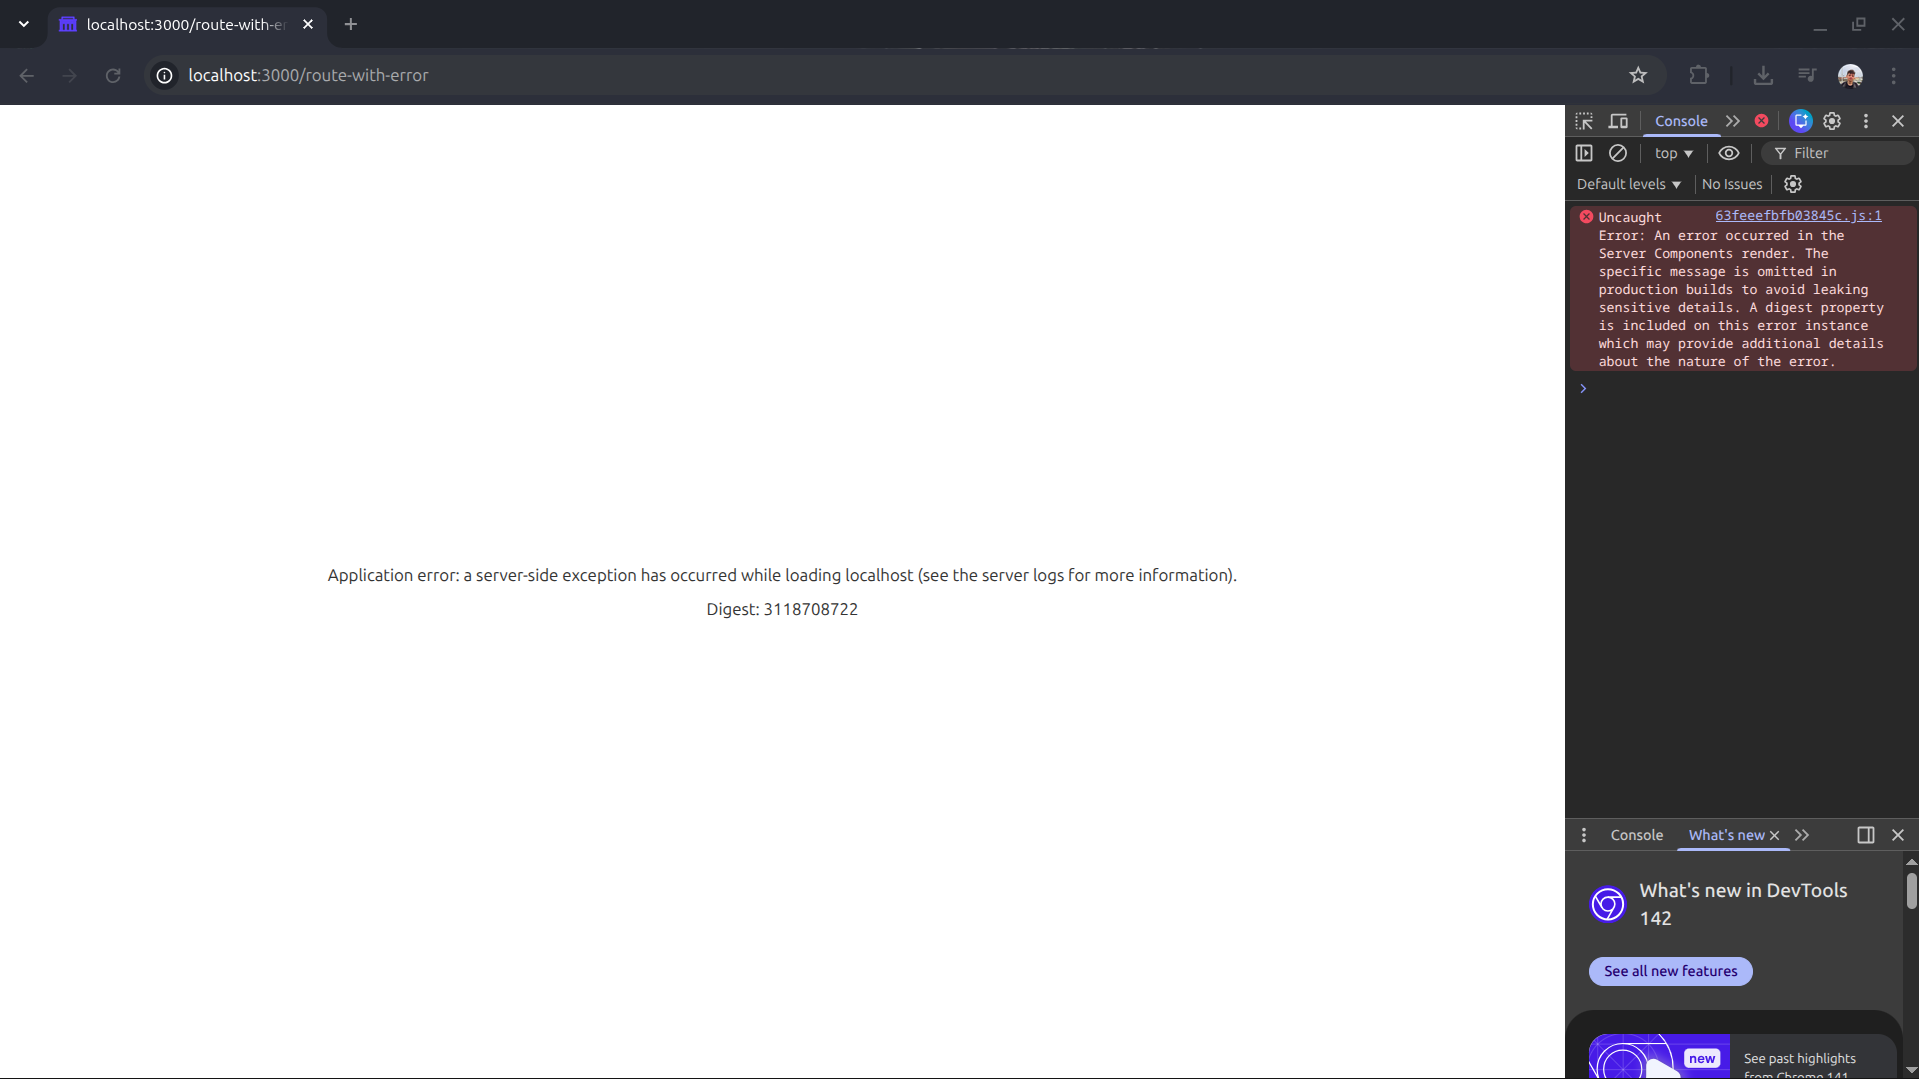
This scenario raises two immediate, massive problems for any dev:
- Reactive Troubleshooting: You only know there was a problem when a user (or worse, a client) actually raises a support ticket. You are always playing defense.
- Debugging Blindly: Without a centralized logging system, trying to reproduce this bug based on a single blank screenshot is nearly impossible. You have no context, no server state, and no stack trace.
The solution to move from reactive guessing to proactive management is Instrumentation. This is the process of integrating specific code into your application to collect operational data, providing the deep visibility needed to understand performance, reliability, and user behavior.
How Instrumentation Works
The process is generally broken down into three logical steps:
- Data Collection (The Application): We modify our Next.js application to include specialized code that collects various kinds of data about the app’s internal state and the host server environment.
- Data Storage (The Telemetry Backends): The collected data is shipped out of the application process and sent to a corresponding, optimized telemetry backend (a database designed specifically for logs, metrics, or traces).
- Visualization (The Dashboard): We use a powerful visualization tool (like Grafana ) to pull the stored data from the backends and present it in cohesive, readable dashboards.
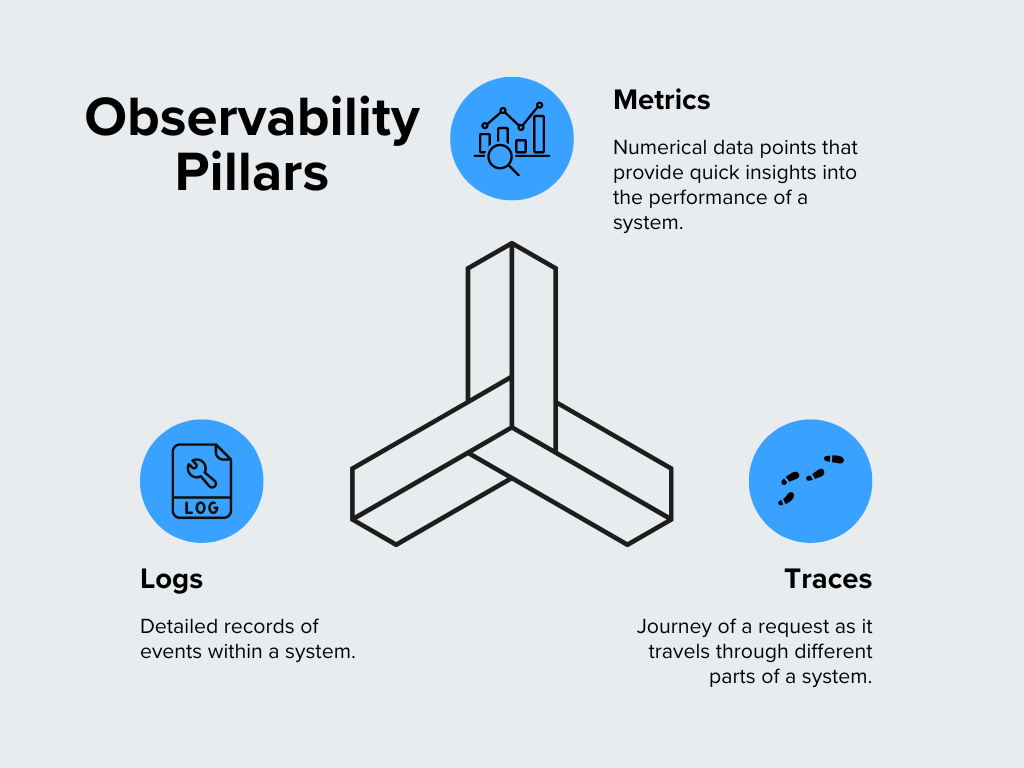
The Three Pillars of Telemetry Data
Instrumentation typically focuses on collecting three distinct kinds of data, often referred to as “The Three Pillars” of observability:
| Kind of data being collected | Definition | Telemetry backend (where is stored) |
|---|---|---|
| Logs | Text records of specific events or states happening within the application. | Loki |
| Metrics | Numerical, aggregate data points (e.g., CPU usage, request latency counts, memory consumption). | Prometheus |
| Traces | The complete journey of a single request as it flows through the various parts of your system. | Tempo |
We will be using the industry-leading tools listed above. While there are alternatives, this combination is battle-tested, and popular.
How to Manage All These Telemetry Backends?
Whenever you are put into a scenario where you have many services that need to communicate with each other over a single network, you should immediately think of Docker and Docker Compose.
- Docker is a tool that allows you to containerize applications, ensuring they run the same way everywhere.
- Docker Compose is an orchestration tool that allows us to define and run multi-container Docker applications.
In our monitoring context, we need five separate services (Grafana, Loki, Prometheus, Tempo, and OpenTelemetry Collector) to communicate with each other over a single network. Docker Compose is the perfect blueprint for defining this monitoring ecosystem simply and repeatably.
In following blogs, we will approach the docker-compose.yml file which defines how our entire local monitoring stack looks.
The Architectural Trade-Off: OTel Purity vs. Pragmatic Simplicity
When discussing modern observability, the OpenTelemetry (OTel) Collector is often hailed as the universal answer. And for good reason—it simplifies large-scale architectures by providing a powerful, centralized pipeline for all telemetry data.
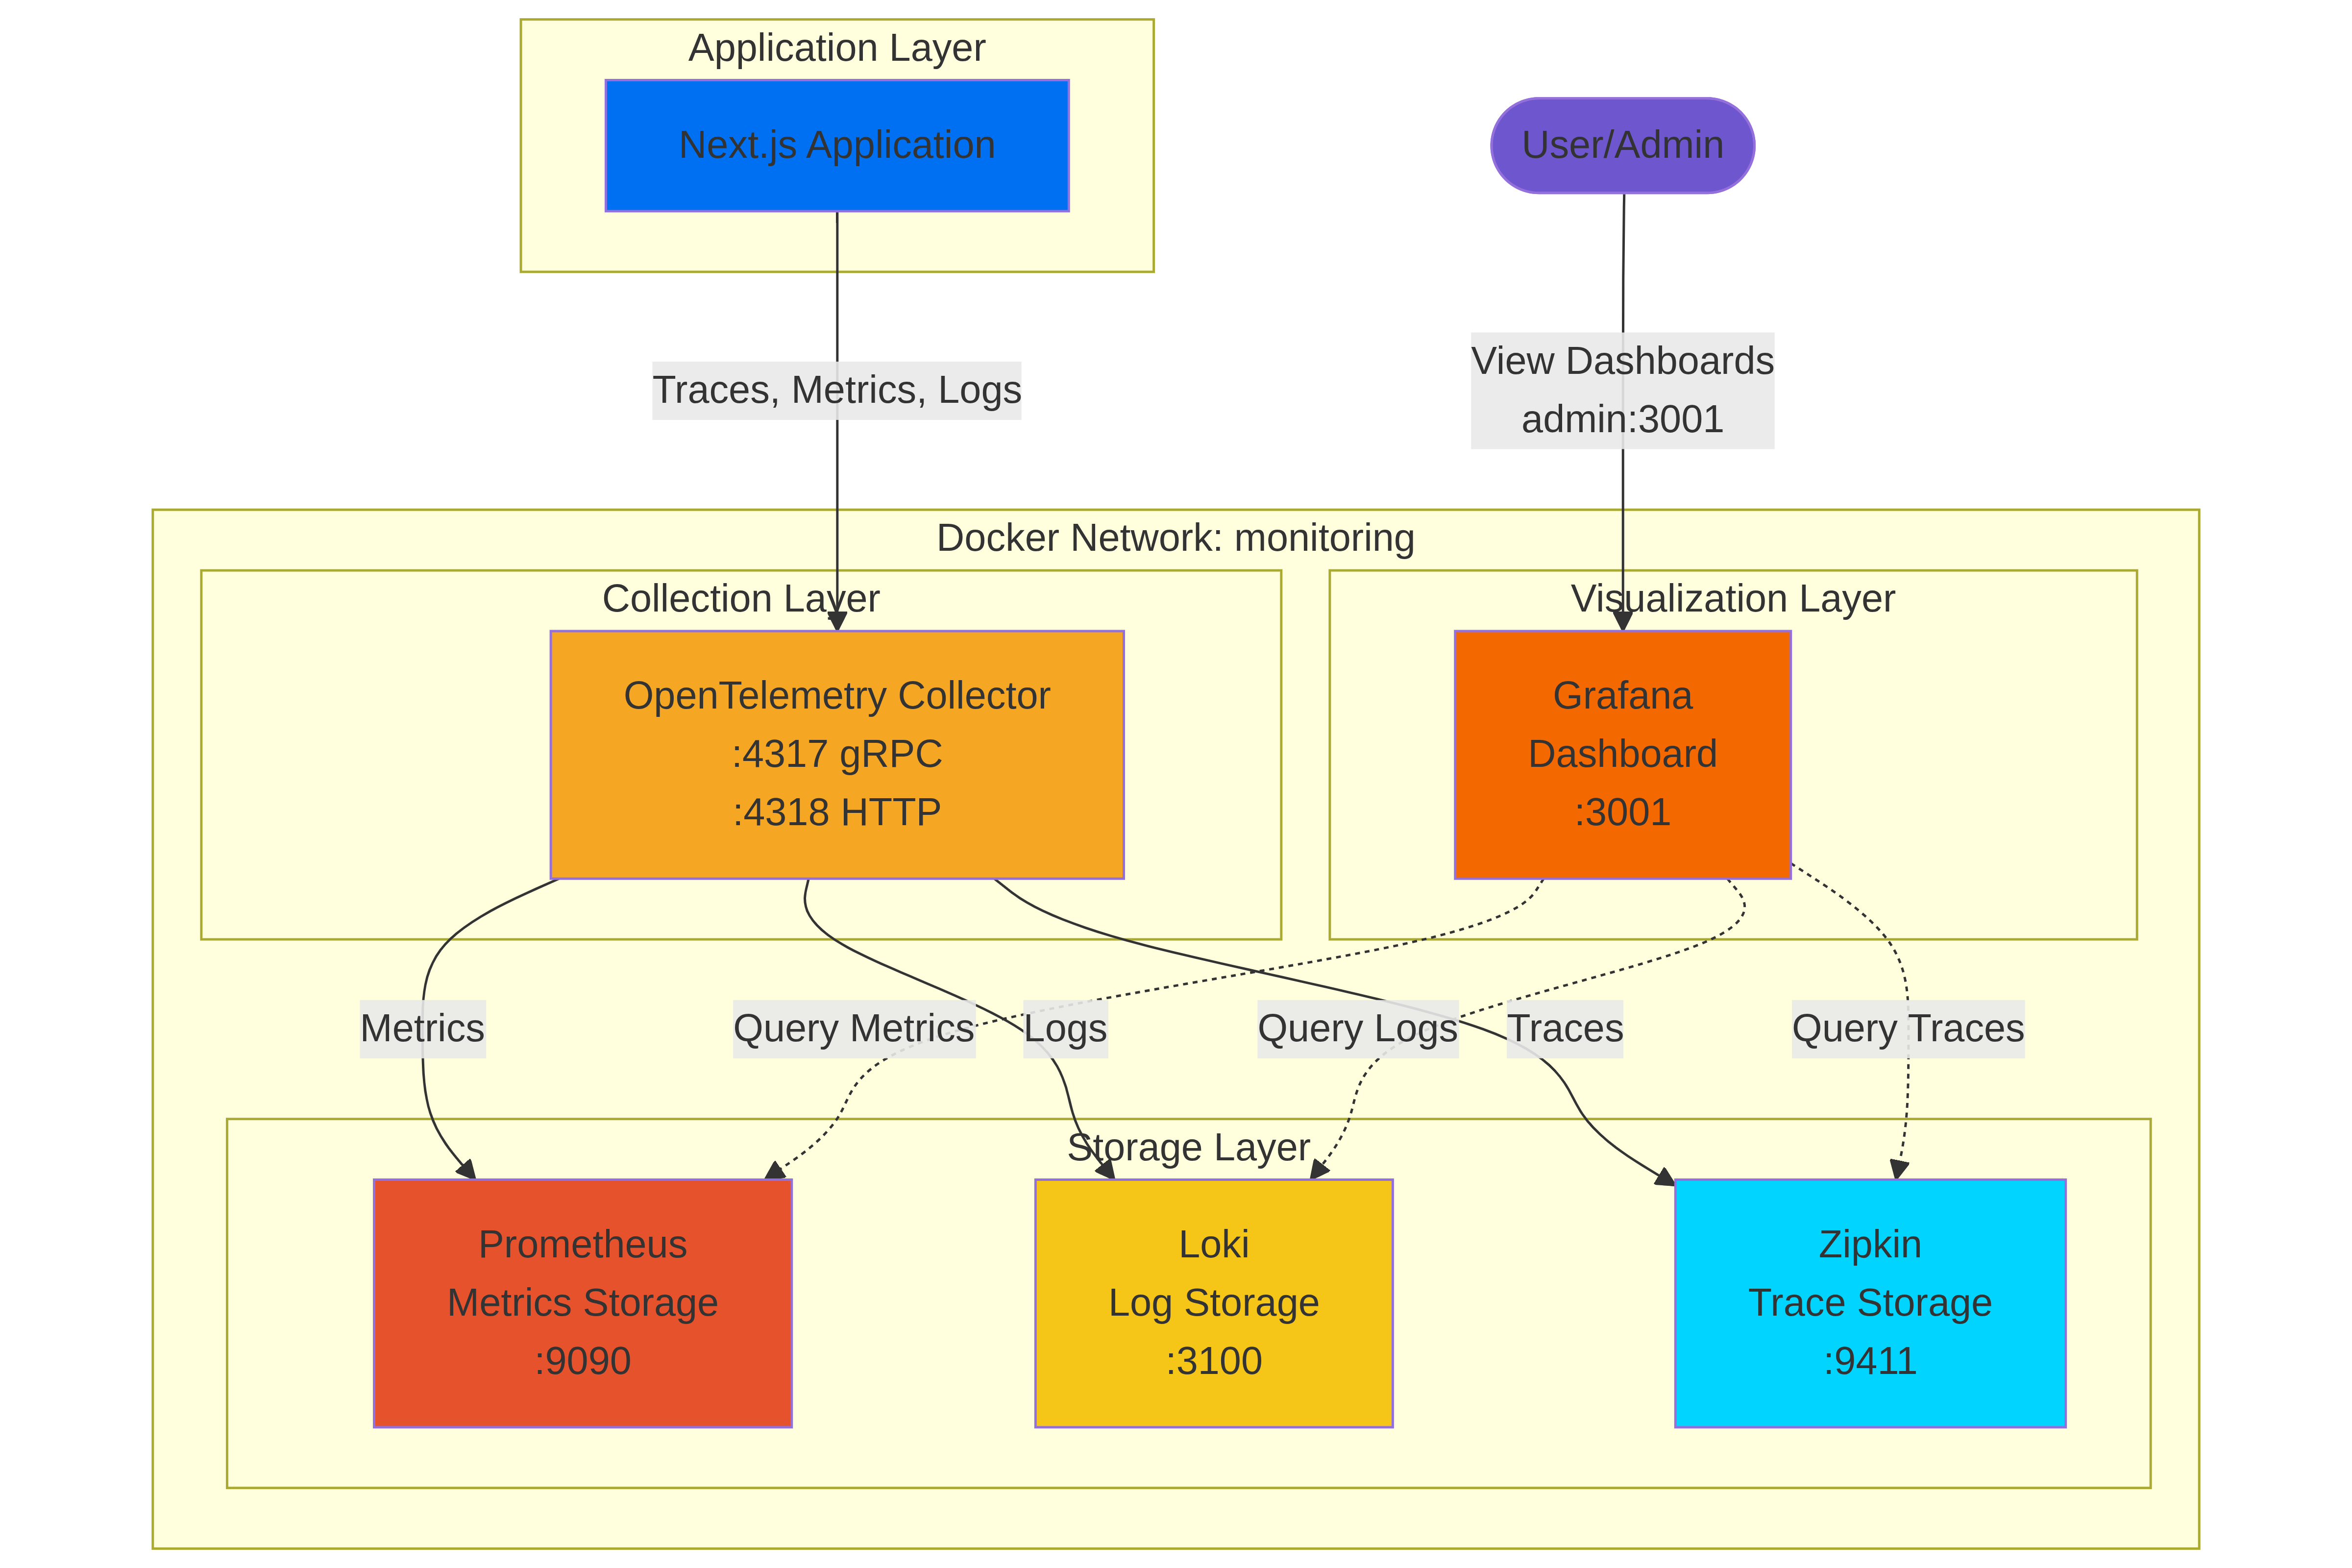
The Industry Recommended Architecture (OTel Centric):
Ideally, every data signal (logs, metrics, and traces) would pass from the Application to the OTel Collector , which would then process and route them to the appropriate backend.
- Single Integration Point: Your application only needs to connect to one OTLP endpoint.
- Decoupling: Your app code doesn’t need to know the specifics of Prometheus or Loki.
- Flexibility & Processing: The collector handles sampling, batching, transformation, and load balancing.
However, as an experienced developer, I’ve learned that the ideal architecture often sacrifices simplicity and maintainability in favor of philosophical purity.
After wrestling to replicate this exact OTel-centric setup for the Next.js Node application, I hit two pragmatic roadblocks that justified simplifying the plan:
- Loki OTLP Maturity: While OTLP support in Loki is improving, configuring the OTLP receiver for logs proved cumbersome compared to existing, dedicated transport libraries.
- Pragmatic Solution: We will bypass OTel for logs and use a proven, direct library: pino-loki .
- Prometheus Metrics Collection: The official OTel NodeSDK doesn’t automatically collect some key Node.js runtime metrics (like CPU usage, heap size, and specific version info) required by standard Grafana Prometheus dashboards.
- Pragmatic Solution: Fighting with custom dashboard JSON or hunting for compatible OTel metric libraries is a time sink. The simplest path is to use the industry-standard Node.js Prometheus library: prom-client , which exports all these metrics automatically via a standard HTTP endpoint that Prometheus can easily scrape.
Therefore, our chosen Practical Architecture will use a hybrid approach that leans on established, simple tools where OTel integration is complex, reserving the OTel Collector for what it does best: Traces.
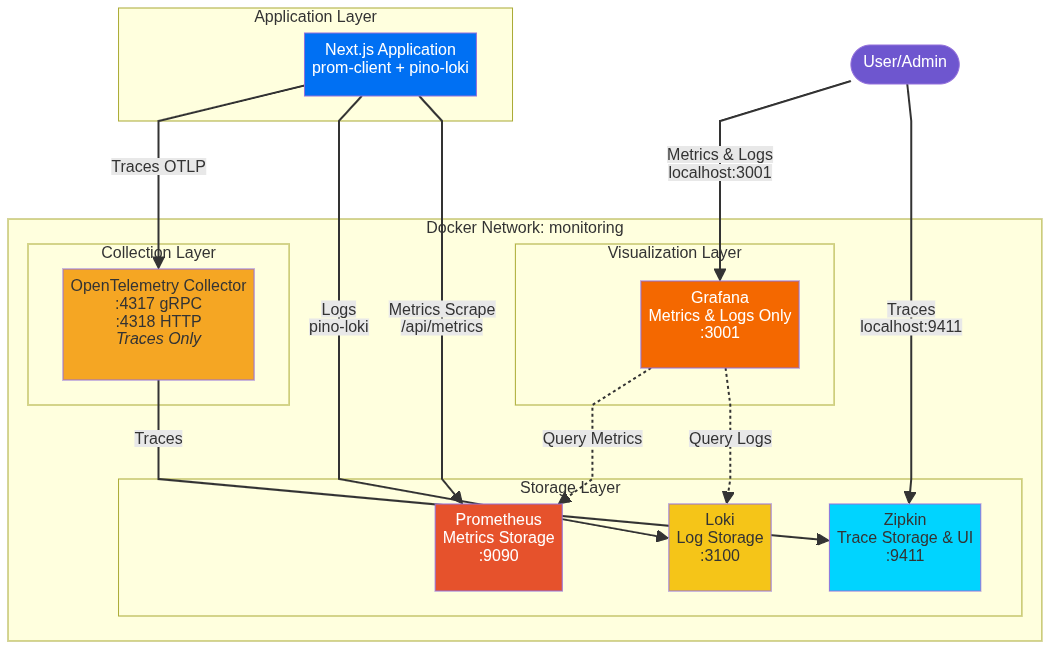
| Component | Industry Ideal (Pure OTel) | Practical Approach (Hybrid) | Justification |
|---|---|---|---|
| OTEL Collector | Handles all signals | Traces only | Focus on reliable, easy trace handling. |
| Logs | App → OTel → Loki | App → Direct (pino-loki) → Loki | Simpler setup, superior library support. |
| Metrics | App → OTel → Prometheus | Prometheus ← Scrapes /api/metrics ← NextJS | Leverages prom-client for rich, automatic runtime metrics. |
This hybrid model gives us full observability with maximum simplicity.
What’s next?
In the next post, we will write the foundational boilerplate code to initialize the monitoring pillars and prepare our “single pane of glass” dashboard: traces alongside metrics and logs within Grafana.